Your monthly cloud infrastructure bill arrives in your inbox. You open the PDF document, and suddenly your left eyelid starts twitching uncontrollably. The finance department has started leaving passive-aggressive sticky notes on your monitor. You realize you are spending the equivalent of a small nation’s gross domestic product just to store text files that repeat “INFO: User logged in” three billion times a day. Welcome to the modern logging crisis.
For years, the Kubernetes logging ecosystem was basically on autopilot. You installed the EFK stack (Elasticsearch, Fluentd, and Kibana), and it just worked. It was the safest default in the industry. But as we navigate through 2026, something has fundamentally ruptured. EFK did not suddenly become toxic waste overnight. It simply became the victim of its own architecture in an era where log volumes have mutated into unrecognizable monsters.
The shift away from EFK is not driven by shiny object syndrome. It is driven by raw economics, hardware exhaustion, and the very human desire not to wake up sweating at 3 AM because a logging cluster ran out of disk space.
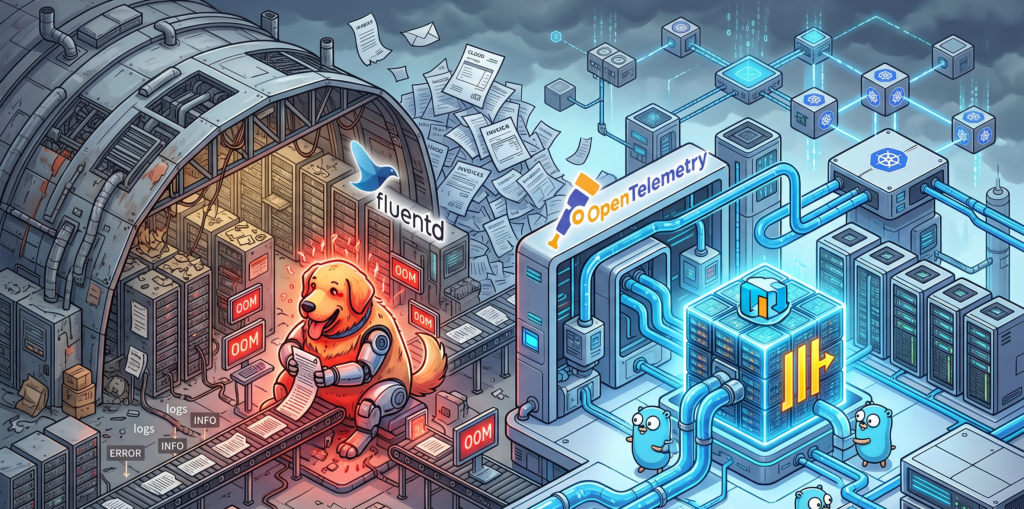
The golden retriever in the sausage factory
Let us start with Fluentd. Fluentd is incredibly stable, highly flexible, and has served the community well. However, it is written in Ruby.
Under moderate loads, Fluentd is a perfectly polite guest. But when you expose it to the high-demand environments of modern microservices, Fluentd exhibits the same impulse control as an unsupervised Golden Retriever locked inside a sausage factory. It just eats all your available CPU and RAM until it physically cannot hold any more, burps an Out Of Memory error, and then politely demands that you scale it horizontally.
This operational overhead becomes exhausting. The industry needed something leaner. Enter the OpenTelemetry Collector. Written in Go, it processes telemetry data with the cold, calculated efficiency of an IRS auditor. It handles metrics, traces, and logs in a unified pipeline without treating your server’s memory like an all you can eat buffet.
Here is what a modern, lightweight pipeline configuration looks like today, completely devoid of Ruby overhead:
The real villain in your cloud bill, however, is not the collector. It is the storage layer. Elasticsearch is an absolute marvel of engineering if you are trying to build a complex search engine for an e-commerce website. But using it exclusively to store application logs is an architectural tragedy.
Storing logs in Elasticsearch is like packing a single pair of socks in an individual cardboard box, wrapping that box in three layers of industrial bubble wrap, and attaching a GPS tracker to it. Yes, the inverted index structure guarantees that you will find those specific socks at the speed of light. But your luggage now occupies three entire aviation hangars, and the monthly rent is absurd. The indexing process creates massive data bloat, multiplying your storage footprint and your anxiety levels simultaneously.
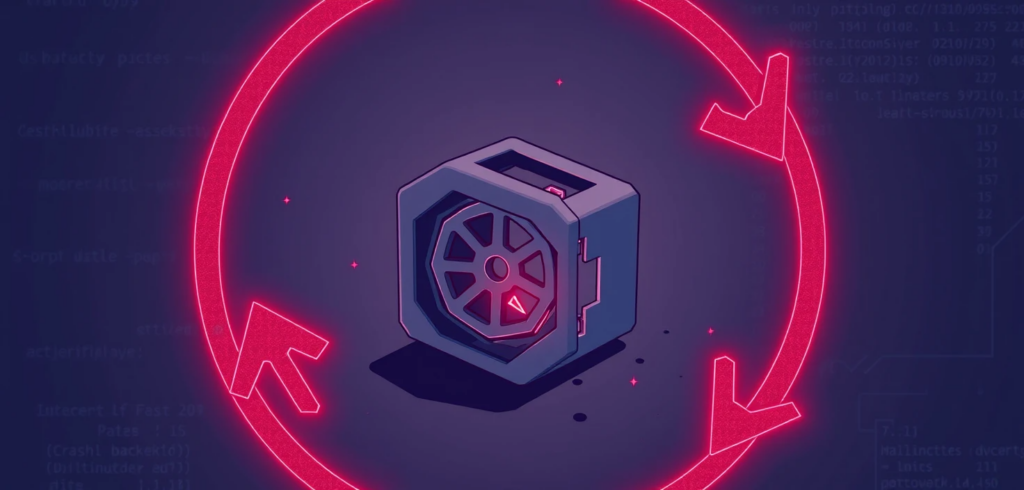
The bouillon cube of observability
This is where ClickHouse enters the scene and aggressively rewrites the rules. ClickHouse looks at your three hangars full of bubble-wrapped socks, throws them into an industrial shredder, and compresses the resulting mass into a super dense data bouillon cube.
ClickHouse relies on columnar storage and sparse indexes. It does not index every single word of your log lines. Instead, it compresses the data so tightly that your storage footprint shrinks to a fraction of what EFK required. And because developers already dream in SQL, querying this massive block of data feels entirely natural.
Instead of wrestling with Kibana’s proprietary query language just to find out why a payment failed, your team can simply run a query like this:
-- Finding errors without going bankrupt
SELECT
    toStartOfMinute(timestamp) AS minute,
    count() AS total_errors,
    dictGet('services', 'name', service_id) AS service_name
FROM application_logs
WHERE level = 'ERROR' AND timestamp > now() - INTERVAL 1 HOUR
GROUP BY minute, service_name
ORDER BY minute DESC;
Grafana sits on top of this SQL engine like a happy gargoyle, providing the exact same dashboarding capabilities you used to get from Kibana, but with the added benefit of seamlessly linking your logs directly to your OpenTelemetry metrics and traces.
Swapping tires on the highway
Now, a word of caution. The worst thing you can do after reading this is to march into your office and delete your Elasticsearch cluster.
Transitioning from EFK to the OpenTelemetry and ClickHouse stack overnight is the IT equivalent of trying to change your car tires while driving at 120 miles per hour down the highway. You will almost certainly lose the chassis in the process.
A migration requires a gradual cutover. You must deploy the OpenTelemetry Collector alongside your existing Fluentd setup. Route a small subset of non critical logs to ClickHouse. Compare the ingestion rates. Let your team practice writing SQL queries to find errors. Only when you are confident that the bouillon cube is holding its shape should you start decommissioning the old, expensive hangars.
When to completely ignore my advice
To be perfectly fair, EFK is not dead for everyone. If your daily log volume fits comfortably on a standard thumb drive, or if your company enjoys setting fire to piles of corporate cash to keep the server room warm, EFK remains a wonderfully easy solution. If your team has zero experience managing relational databases and relies heavily on managed Elasticsearch services, moving to ClickHouse might introduce more friction than it resolves.
But for the rest of the world, the verdict is clear. Do not migrate just because it is trendy. Migrate because your current system has become a financial bottleneck. If your Elasticsearch bill is the fastest growing metric in your entire company, that is your signal. Run the numbers, evaluate the OpenTelemetry stack, and stop paying hangar prices for your socks.
The pager goes off at 3 AM. Your most critical Kubernetes node is gasping for air. You SSH into the box, but your fancy cloud observability agents are completely frozen. You cannot run top, htop is a distant dream, and your metrics dashboard is just a spinning loading wheel of despair.
What do you do now?
Most people panic. But if you know where to look, your Linux server has a secret, real-time dashboard built right in. It requires zero agents, consumes zero disk space, and is literally generating its data on the fly just for you.
Welcome to the weird, wonderful, and slightly chaotic world of the proc pseudo-filesystem.
The hallucinated filesystem
If you run ls /proc, you will see what looks like a messy drawer full of text files and numbered directories. It is easy to dismiss it as legacy kernel clutter. But here is the bizarre truth about this directory. It does not exist.
Not on your SSD, anyway. The proc filesystem is a pure hallucination managed by the kernel. It exists entirely in RAM. The files inside it have a size of zero bytes right up until the exact microsecond you try to read them. When you run cat /proc/uptime, the kernel intercepts your request, hastily scribbles down the current system state, and hands it back to you.
It is the “everything is a file” Unix philosophy taken to its absolute, absurd logical conclusion. And once you understand how to read it, it becomes an indispensable tool for Cloud Architecture and DevOps engineers.
Gold nuggets for your daily rotation
You do not need to memorize every file in here. Treat it like a hardware store. You only need to know where the hammers and screwdrivers are kept.
The memory health check
Checking /proc/meminfo gives you your memory health at a glance, long before you even try to execute free -h. It is the raw, unfiltered truth about your RAM.
The CPU heartbeat
You can check /proc/loadavg and /proc/stat to understand CPU load and scheduler activity. Load average is like looking at the queue outside a nightclub. It tells you how many processes are waiting to get onto the CPU dance floor.
The network socket inventory
When you are trapped inside a stripped-down Docker container that lacks ss or netstat, /proc/net/tcp and /proc/net/udp are your best friends. They list every active socket connection.
The runtime clock
A quick look at /proc/uptime gives you the system runtime and idle time in a single line. It is incredibly easy to parse for quick uptime checks in your automation scripts.
Peeking inside running applications
If the root of this filesystem is the global state of the machine, the numbered directories are the personal diaries of every running application. Each number corresponds to a Process ID.
Finding the exact command
Sometimes, ps truncates output or is not installed. You can read /proc/<pid>/cmdline to see the exact, literal command that launched the process, null bytes and all.
Reading the environment
Checking /proc/<pid>/environ reveals the environment variables the process started with. It is an absolute goldmine for debugging and a terrifying danger zone for security. Environment variables are like a bouncer who will not let the application start unless its name is on the list, and the application brought the list itself.
Chasing file descriptors
If you ever hit a “too many open files” error, look inside /proc/<pid>/fd/. This directory contains symlinks to every single file, socket, and pipe the application is currently holding onto.
Surviving the cloud native illusion
Containers are, fundamentally, just Linux processes lying to themselves about how much of the world they own. They think they are the only tenant in the building. When you are working with Kubernetes, this pseudo-filesystem bridges the gap between the illusion and the reality.
When eBPF tools or your sidecar agents fail, this interface is your manual override. You can check /proc/<pid>/cgroup to see exactly which control groups are clamping down on your process. If a container keeps getting killed by the Out Of Memory killer, you can watch /proc/<pid>/oom_score to see how angry the kernel is getting at that specific process. The higher the number, the more likely the kernel is going to take it out back and end its misery.
War stories from the trenches
Theoretical knowledge is great, but let us look at how this saves your skin when you are sleep deprived.
The phantom disk filler
Your alerts say the disk is at 100%. You find a massive 50GB application log and delete it. You run df -h again. The disk is still at 100%. What happened? The application is still writing to the deleted file. A file is not truly deleted until the last process closes it. Running lsof or digging through /proc/<pid>/fd will show you the deleted file still held open by the stubborn process. Restart the process, and your 50GB magically returns.
The frozen startup
An application hangs immediately on startup. It is not using CPU, and it is not crashing. What is it waiting for? Inspecting /proc/<pid>/wchan will literally tell you the exact kernel function where the process went to sleep.
The dark side of the dashboard
It is not all sunshine and perfectly formatted data. There are traps here.
First, formatting varies between kernel versions. Writing a strict regular expression to parse these files in a production bash script is a recipe for tears. Always use defensive coding.
Second, the /proc/sys/ directory is not just for looking. It is for touching. This is where kernel tunables live, the underlying mechanism for sysctl. Writing the wrong value here can permanently break your network stack or cause a kernel panic faster than you can hit Ctrl+C. Look, but do not touch unless you have read the documentation twice.
Quick reference sheet
Keep this list handy for your next terminal session.
cat /proc/cpuinfo shows your hardware details
cat /proc/version gives you the exact kernel and distro info
ls -l /proc/<pid>/fd displays live file descriptors
cat /proc/net/dev reveals network interface stats
echo 3 > /proc/sys/vm/drop_caches frees up pagecache, dentries, and inodes (and makes your database administrator incredibly nervous)
Keep a terminal open to your kernel
This interface is the universal API. It is present when your monitoring tools are broken, when your containers are stripped bare, and when the orchestrator is lying to you.
Next time you SSH into a server or run kubectl exec into a pod, take a second to explore this directory before you reflexively type htop. In the cloud, understanding this in-memory filesystem means you understand exactly what your platform sees. And that is the kind of visibility no vendor can sell you.
It’s 3 AM. The pager screams, a digital banshee heralding doom. You stumble to your desk, eyes blurry, to find a Slack channel ablaze with panicked messages. The checkout service is broken. Customers are furious. Revenue is dropping.
You pull up the dashboards, your sacred scrolls of system health. Everything is… fine. P95 latency is a flat line of angelic calm. CPU usage is so low it might as well be on a tropical vacation. The error count is zero. According to your telemetry, the system is a picture of perfect health.
And yet, the world is on fire.
Welcome to the great lie of modern observability. We’ve become masters at measuring signals while remaining utterly clueless about the story they’re supposed to tell. This isn’t a guide about adding more charts to your dashboard collection. It’s about teaching your system to stop mumbling in arcane metrics and start speaking human. It’s about making it tell you the truth.
The seductive lie of the green dashboard
We were told to worship the “golden signals”: latency, traffic, errors, and saturation. They’re like a hospital patient’s vital signs. They can tell you if the patient is alive, but they can’t tell you why they’re miserable, what they argued about at dinner, or if they’re having an existential crisis.
Our systems are having existential crises all the time.
Latency lies when the real work is secretly handed off to a background queue. The user gets a quick “OK!” while their request languishes in a forgotten digital purgatory.
Traffic lies when a buggy client gets stuck in a retry loop, making it look like you’re suddenly the most popular app on the internet.
Errors lie when you only count the exceptions you had the foresight to catch, ignoring the vast, silent sea of things failing in ways you never imagined.
Golden signals are fine for checking if a server has a pulse. But they are completely useless for answering the questions that actually keep you up at night, like, “Why did the CEO’s demo fail five minutes before the big meeting?”
The truth serum: Semantic Observability
The antidote to this mess is what we’ll call semantic observability. It’s a fancy term for a simple idea: instrumenting the meaning of what your system is doing. It’s about capturing the plot, not just the setting.
Instead of just logging Request received, we record the business-meaningful story:
Domain events: The big plot points. UserSignedUp, CartAbandoned, InvoiceSettled, FeatureFlagEvaluated. These are the chapters of your user’s journey.
Intent assertions: What the system swore it would do. “I will try this payment gateway up to 3 times,” or “I promise to send this notification to the user’s phone.”
Outcome checks: The dramatic conclusion. Did the money actually move? Was the email really delivered? This is the difference between “I tried” and “I did.”
Let’s revisit our broken checkout service. Imagine a user is buying a book right after you’ve flipped on a new feature flag for a “revolutionary” payment path.
With classic observability, you see nothing. With semantic observability, you can ask your system questions like a detective interrogating a witness:
“Show me all the customers who tried to check out in the last 30 minutes but didn’t end up with a successful order.”
“Of those failures, how many had the new shiny-payment-path feature flag enabled?”
“Follow the trail for one of those failed orders. What was the last thing they intended to do, and what was the actual, tragic outcome?”
Notice we haven’t mentioned CPU once. We’re asking about plot, motive, and consequence.
Your detective’s toolkit (Minimal OTel patterns)
You don’t need a fancy new vendor to do this. You just need to use your existing OpenTelemetry tools with a bit more narrative flair.
Teach your spans to gossip: Don’t just create a span; stuff its pockets with juicy details. Use span attributes to carry the context. Instead of just a request_id, add feature.flag.variant, customer.tier, and order.value. Make it tell you if this is a VIP customer buying a thousand-dollar item or a tire-kicker with a free-tier coupon.
Mark the scene of the crime: Use events on spans to log key transitions. FraudCheckPassed, PaymentAuthorized, EnteringRetryLoop. These are the chalk outlines of your system’s behavior.
Connect the dots: For asynchronous workflows (like that queue we mentioned), use span links to connect the cause to the effect. This builds a causal chain so you can see how a decision made seconds ago in one service led to a dumpster fire in another.
Rule of thumb:If a human is asking the question during an incident, a machine should be able to answer it with a single query.
The case of intent vs. outcome
This is the most powerful trick in the book. Separate what your system meant to do from what actually happened.
The intent: At the start of a process, emit an event: NotificationIntent with details like target: email and deadline: t+5s.
The outcome: When (or if) it finishes, emit another: NotificationDelivered with latency: 2.5s and channel: email.
Now, your master query isn’t about averages. It’s about broken promises: “Show me all intents that don’t have a matching successful outcome within their SLA.”
Suddenly, your SLOs aren’t some abstract percentage. They are a direct measure of your system’s integrity: its intent satisfied rate.
Your first 30 days as a telemetry detective
Week 1: Pick a single case. Don’t boil the ocean. Focus on one critical user journey, like “User adds to cart -> Pays -> Order created.” List the 5-10 key “plot points” (domain events) and 3 “promises” (intent assertions) in that story.
Week 2: Plant the evidence. Go into your code and start enriching your existing traces. Add those gossipy attributes about feature flags and customer tiers. Add events. Link your queues.
Week 3: Build your “Why” query. Create the one query that would have saved you during the last outage. Something like, “Show me degraded checkouts, grouped by feature flag and customer cohort.” Put a link to it at the top of your on-call runbook.
Week 4: Close the loop. Define an SLO on your new “intent satisfied rate.” Watch it like a hawk. Review your storage costs and turn on tail-based sampling to keep the interesting stories (the errors, the weird edge cases) without paying to record every boring success story.
Anti-Patterns to gently escort out the door
Dashboard worship: If your incident update includes a screenshot of a CPU graph, you owe everyone an apology. Show them the business impact, the cohort of affected users, the broken promise.
Logorrhea: The art of producing millions of lines of logs that say absolutely nothing. One good semantic event is worth a thousand INFO: process running logs.
Tag confetti: Using unbounded tags like user_id for everything, turning your observability bill into a piece of abstract art that costs more than a car.
Schrödinger’s feature flag: Shipping a new feature behind a flag but forgetting to record the flag’s decision in your telemetry. The flag is simultaneously the cause of and solution to all your problems, and you have no way of knowing which.
The moral of the story
Observability isn’t about flying blind without metrics. It’s about refusing to outsource your understanding of the system to a pile of meaningless averages.
Instrument intent. Record outcomes. Connect causes.
When your system can clearly explain what it tried to do and what actually happened, on-call stops feeling like hunting for ghosts in a haunted house and starts feeling like science. And you might even get a full night’s sleep.
There’s a dusty shelf in every network closet where good intentions go to die. Or worse, to gossip. You centralize DNS for simplicity. You enable logging for accountability. You peer VPCs for convenience. A few sprints later, your DNS logs have become that chatty neighbor who sees every car that comes and goes, remembers every visitor, and pieces together a startlingly accurate picture of your life.
They aren’t leaking passwords or secret keys. They’re leaking something just as valuable: the blueprints of your digital house.
This post walks through a common pattern that quietly spills sensitive clues through AWS Route 53 Resolver query logging. We’ll skip the dry jargon and focus on the story. You’ll leave with a clear understanding of the problem, a checklist to investigate your own setup, and a handful of small, boring changes that buy you a lot of peace.
The usual suspects are a disaster recipe in three easy steps
This problem rarely stems from one catastrophic mistake. It’s more like three perfectly reasonable decisions that meet for lunch and end up burning down the restaurant. Let’s meet the culprits.
1. The pragmatic architect
In a brilliant move of pure common sense, this hero centralizes DNS resolution into a single, shared network VPC. “One resolver to rule them all,” they think. It simplifies configuration, reduces operational overhead, and makes life easier for everyone. On paper, it’s a flawless idea.
2. The visibility aficionado
Driven by the noble quest for observability, this character enables Route 53 query logging on that shiny new central resolver. “What gets measured, gets managed,” they wisely quote. To be extra helpful, they associate this logging configuration with every single VPC that peers with the network VPC. After all, data is power. Another flawless idea.
3. The easy-going permissions manager
The logs have to land somewhere, usually a CloudWatch Log Group or an S3 bucket. Our third protagonist, needing to empower their SRE and Ops teams, grants them broad read access to this destination. “They need it to debug things,” is the rationale. “They’re the good guys.” A third, utterly flawless idea.
Separately, these are textbook examples of good cloud architecture. Together, they’ve just created the perfect surveillance machine: a centralized, all-seeing eye that diligently writes down every secret whisper and then leaves the diary on the coffee table for anyone to read.
So what is actually being spilled
The real damage comes from the metadata. DNS queries are the internal monologue of your applications, and your logs are capturing every single thought. A curious employee, a disgruntled contractor, or even an automated script can sift through these logs and learn things like:
Service Hostnames that tell a story: Names like billing-api.prod.internal or customer-data-primary-db.restricted.internal do more than just resolve to an IP. They reveal your service names, their environments, and even their importance.
Secret project names: That new initiative you haven’t announced yet? If its services are making DNS queries like project-phoenix-auth-service.dev.internal, the secret’s already out.
Architectural hints: Hostnames often contain roles like etl-worker-3.prod, admin-gateway.staging, or sre-jumpbox.ops.internal. These are the labels on your architectural diagrams, printed in plain text.
Cross-Environment chatter: The most dangerous leak of all. When a query from a dev VPC successfully resolves a hostname in the prod environment (e.g., prod-database.internal), you’ve just confirmed a path between them exists. That’s a security finding waiting to happen.
Individually, these are harmless breadcrumbs. But when you have millions of them, anyone can connect the dots and draw a complete, and frankly embarrassing, map of your entire infrastructure.
Put on your detective coat and investigate your own house
Feeling a little paranoid? Good. Let’s channel that energy into a quick investigation. You don’t need a magnifying glass, just your AWS command line.
Step 1 Find the secret diaries
First, we need to find out where these confessions are being stored. This command asks AWS to list all your Route 53 query logging configurations. It’s the equivalent of asking, “Where are all the diaries kept?”
Take note of the DestinationArn for any configs with a high VpcCount. Those are your prime suspects. That ARN is the scene of the crime.
Step 2 Check who has the keys
Now that you know where the logs are, the million-dollar question is: who can read them?
If the destination is a CloudWatch Log Group, examine its resource-based policy and also review the IAM policies associated with your user roles. Are there wildcard permissions like logs:Get* or logs:* attached to broad groups?
If it’s an S3 bucket, check the bucket policy. Does it look something like this?
This policy generously gives every single IAM user and role in the account access to read all the logs. It’s the digital equivalent of leaving your front door wide open.
Step 3 Listen for the juicy gossip
Finally, let’s peek inside the logs themselves. Using CloudWatch Log Insights, you can run a query to find out if your non-production environments are gossiping about your production environment.
fields @timestamp, @message
| filter @message like /\.prod\.internal/
| filter vpc.id not like /vpc-prod-environment-id/
| stats count(*) by vpc.id as sourceVpc
| sort by @timestamp desc
This query looks for any log entries that mention your production domain (.prod.internal) but did not originate from a production VPC. Any results here are a flashing red light, indicating that your environments are not as isolated as you thought.
The fix is housekeeping, not heroics
The good news is that you don’t need to re-architect your entire network. The solution isn’t some heroic, complex project. It’s just boring, sensible housekeeping.
Be granular with your logging: Don’t use a single, central log destination for every VPC. Create separate logging configurations for different environments (prod, staging, dev). Send production logs to a highly restricted location and development logs to a more accessible one.
Practice a little scrutiny: Just because a resolver is shared doesn’t mean its logs have to be. Associate your logging configurations only with the specific VPCs that absolutely need it.
Embrace the principle of least privilege: Your IAM and S3 bucket policies should be strict. Access to production DNS logs should be an exception, not the rule, requiring a specific IAM role that is audited and temporary.
That’s it. No drama, no massive refactor. Just a few small tweaks to turn your chatty neighbor back into a silent, useful tool. Because at the end of the day, the best secret-keeper is the one who never heard the secret in the first place.
Every engineer loves a good dashboard. The vibrant graphs, the neat panels, the comforting glow of a wall of green lights. It’s the digital equivalent of a clean garage; it feels productive, organized, and ready for anything.
But let’s be honest: your dashboards are probably lying to you. They’re like a well-intentioned friend who tells you everything’s fine when you’ve got a smudge of chocolate on your nose and a bird nesting in your hair. They show you the surface, but hide the messy, inconvenient truth.
I learned this the hard way, at 2 a.m., as all the best lessons are learned. We were on-call when production latency went absolutely bonkers. I stared at four massive dashboards, each with a dozen panels of metrics swirling on my screen: CPU, memory, queue depth, disk I/O, HPA stats, all the usual suspects. I was a detective with a thousand clues but no insights, scrolling through what felt like a colorful, confusing kaleidoscope.
An hour of this high-octane confusion later, we discovered the culprit: a single, rogue DNS misconfiguration in a downstream service. The dashboards, those beautiful, useless liars, had all been glowing green.
This isn’t just bad luck. It’s a design flaw.
Designed for reports, not for war
Most dashboards are built for managers who need to glance at high-level metrics during a meeting, not for engineers trying to solve a full-blown crisis. We obsess over the shiny vanity metrics: request counts and 99th percentile latency, while the real demons, the retry storms and misbehaving clients, hide in the shadows.
Think of it like this: your dashboard is a doctor who only checks your height and weight. You might look great on paper, but your appendix could be about to explode. The surface looks fine, but the guts are in chaos.
The graveyard of abandoned dashboards
Have you ever wondered where old dashboards go to die? The answer is: nowhere. They simply get abandoned, like a pet you can no longer care for. Metrics get deprecated, panels start showing N/A, and alerts get muted permanently. They become relics of a bygone era, cluttering your screens with useless data and false promises. It’s the digital equivalent of that one junk drawer in your kitchen; it feels organized at a glance, but you know deep down it’s a monument to things you’ll never use again.
Too much signal, too much noise
Adding more panels doesn’t automatically give you better visibility. At scale, dashboards become a cacophony of white noise. You spend 30 minutes scanning, 5 minutes guessing, and 10 minutes restarting pods just to see if the blinking stops. That’s not observability; that’s panic dressed up as process.
Imagine trying to find your house key on a keychain with 500 different keys on it. You can see all of them, but you can’t find the one you need when you’re standing in the rain.
So, how do you fix it? You stop making art and start getting answers.
From Metrics to Methods
We stopped dumping metrics onto giant boards and created what we called “Runbooks with Graphs.” Instead of a hundred metrics per service, we had a handful per failure mode. It’s a fundamental shift in perspective.
This simple shift grouped our metrics by the why, not just the what.
Slaying Alert Fatigue
We took a good, hard look at our alerts and deleted 40% of them. Then, we rebuilt them from the ground up, basing them on symptoms, not raw metrics. This meant getting rid of things like this:
# BEFORE: A useless alert
- alert: HighCPULoad
  expr: avg(cpu_usage_rate) > 0.8
  for: 5m
  labels:
    severity: warning
  annotations:
    summary: "High CPU on instance {{ $labels.instance }}"
And replacing it with something like this:
# AFTER: A meaningful, symptom-based alert
- alert: CustomerFacingSLOViolation
  expr: rate(http_requests_total{status_code!~"2.."}) / rate(http_requests_total) > 0.1
  for: 2m
  labels:
    severity: critical
  annotations:
    summary: "Too many failed API requests - SLO violated"
    description: "The percentage of failed requests is over 10%."
Suddenly, the team trusted the alerts again. When the pager went off, it actually meant something was wrong for the customers, not just a server having a bad day.
Blackhole checks and truth bombs
If dashboards can lie, you need tools that don’t. We added synthetic tests and end-to-end user simulations. These act like a secret shopper for your service, proving something is broken, whether your metrics look good or not.
Here’s a simple example of a synthetic check:
const axios = require('axios');
async function checkAPIMetrics() {
  try {
    const response = await axios.get('https://api.yourcompany.com/v1/health');
    if (response.status !== 200) {
      throw new Error(`Health check failed with status: ${response.status}`);
    }
    console.log('API is healthy.');
  } catch (error) {
    console.error('API health check failed:', error.message);
    // Send alert to PagerDuty or Slack
  }
}
checkAPIMetrics();
Your internal metrics may say “OK,” but a synthetic user never lies about the customer’s experience.
The hard truth
Dashboards don’t solve outages. People do. They’re useful, but only if they’re maintained, contextual, and grounded in real-world operations. If your dashboards don’t reflect how failures actually unfold, they’re not observability, they’re art. And in the middle of a P1 incident, you don’t need art. You need answers.
This is the part where I’m supposed to give you a tidy, inspirational conclusion. Something about how we can all be better, more vigilant SREs. But let’s be realistic. The truth is, the world is full of dashboards that are just digital wallpaper, beautiful to look at, utterly useless in a crisis. They’re a collective delusion that makes us feel like we have everything under control, when in reality, we’re just scrolling through colorful confusion, hoping something will catch our eye.
So, before you build another massive, 50-panel dashboard, stop and ask yourself: is this going to help me at 2 a.m., with my coffee pot empty and a panic-stricken developer on the other end of the line? Or is it just another pretty lie to add to the collection?
How many of your dashboards are truly battle-ready? And which ones are just decorative?
Let’s be honest. For the better part of a decade, the public cloud has been the charismatic, free-spending friend who gets you out of any jam. Need to throw a last-minute party for a million users? They’ve got the hardware. Need to scale an app overnight? They’re already warming up the car. It was fast, it was elastic, and it saved you from the tedious, greasy work of racking your own servers. The only price was a casual, “You can pay me back later.”
Well, it’s later. The bill has arrived, and it has more cryptic line items than a forgotten ancient language. The finance department is calling, and they don’t sound happy.
This isn’t an angry stampede for the exits. Nobody is burning their AWS credits in protest. It’s more of a pragmatic reshuffle, a collective moment of clarity. Teams are looking at their sprawling digital estates and asking a simple question: Does everything really need to live in this expensive, all-inclusive resort? The result is a new normal where the cloud is still essential, just not universal.
The financial hangover
The cloud is wonderfully elastic. Elastic things, by their nature, bounce. So do monthly statements. Teams that scaled at lightning speed are now waking up to a familiar financial hangover with four distinct symptoms. First, there’s the billing complexity. Your monthly invoice isn’t a bill; it’s a mystery novel written by a sadist. Thousands of line items, tiered pricing, and egress charges transform the simple act of “moving data” into a budget-devouring monster.
-- A query that looks innocent but costs a fortune in data egress
SELECT
    event_id,
    user_id,
    payload
FROM
    user_events_production.events_archive
WHERE
    event_date BETWEEN '2025-07-01' AND '2025-07-31'
    AND region != 'eu-central-1'; -- Oh, you wanted to move 5TB across continents? That'll be extra.
Second is the unpredictable demand. A few busy weeks, a successful marketing campaign, or a minor viral event can undo months of careful savings plans. You budget for a quiet month, and suddenly you’re hosting the Super Bowl.
Then come the hidden multipliers. These are the gremlins of your infrastructure. Tiny, seemingly insignificant charges for cross-AZ traffic, managed service premiums, and per-request pricing that quietly multiply in the dark, feasting on your budget.
Finally, there’s the convenience tax. You paid a premium to turn the pain of operations into someone else’s problem. But for workloads that are steady, predictable, and bandwidth-heavy, that convenience starts to look suspiciously like setting money on fire. Those workloads are starting to look much cheaper on hardware you own or lease, where capital expenditure and depreciation replace the tyranny of per-hour-everything.
The gilded cage of convenience
Cloud providers don’t lock you in with malice. They seduce you with helpfulness. They offer a proprietary database so powerful, an event bus so seamless, an identity layer so integrated that before you know it, your application is woven into the very fabric of their ecosystem.
Leaving isn’t a migration; it’s a full-scale renovation project. It’s like living in a luxury hotel. They don’t forbid you from leaving, but once you’re used to the 24/7 room service, are you really going to go back to cooking for yourself?
Faced with this gilded cage, smart teams are now insisting on a kind of technological prenuptial agreement. It’s not about a lack of trust; it’s about preserving future freedom. Where practical, they prefer:
Open databases or engines with compatible wire protocols.
Kubernetes with portable controllers over platform-specific orchestration.
OpenTelemetry for metrics and traces that can travel.
Terraform or Crossplane to describe infrastructure in a way that isn’t tied to one vendor.
This isn’t purity theater. It simply reduces the penalty for changing your mind later.
# A portable infrastructure module
# It can be pointed at AWS, GCP, or even an on-prem vSphere cluster
# with the right provider.

resource "kubernetes_namespace" "app_namespace" {
  metadata {
    name = "my-awesome-app"
  }
}

resource "helm_release" "app_database" {
  name       = "app-postgres"
  repository = "https://charts.bitnami.com/bitnami"
  chart      = "postgresql"
  namespace  = kubernetes_namespace.app_namespace.metadata[0].name

  values = [
    "${file("values/postgres-prod.yaml")}"
  ]
}
A new menu of choices
The choice is no longer just between a hyperscaler and a dusty server cupboard under the stairs. The menu has expanded:
Private cloud: Using platforms like OpenStack or Kubernetes on bare metal in a modern colocation facility.
Alternative clouds: A growing number of providers are offering simpler pricing and less lock-in.
Hybrid models: Keeping sensitive data close to home while bursting to public regions for peak demand.
Edge locations: For workloads that need to be physically close to users and hate round-trip latency.
The point isn’t to flee the public cloud. The point is workload fitness. You wouldn’t wear hiking boots to a wedding, so why run a predictable, data-heavy analytics pipeline on a platform optimized for spiky, uncertain web traffic?
A personality test for your workload
So, how do you decide what stays and what goes? You don’t need a crystal ball. You just need to give each workload a quick personality test. Ask these six questions:
Is its demand mostly steady or mostly spiky? Is it a predictable workhorse or a temperamental rock star?
Is its data large and chatty or small and quiet?
Is latency critical? Does it need instant responses or is a few dozen milliseconds acceptable?
Are there strict data residency or compliance rules?
Does it rely on a proprietary managed service that would be a nightmare to replace?
Can we measure its unit economics? Do we know the cost per request, per user, or per gigabyte processed?
Steady and heavy often wins on owned or leased hardware. Spiky and uncertain still loves the elasticity of the hyperscalers. Regulated and locality-bound prefer the control of a private or hybrid setup. And if a workload gets its superpowers from a proprietary managed service, you either keep it where its powers live or make peace with a less super version of your app.
What does this mean for you, Architect
If you’re a DevOps engineer or a Cloud Architect, congratulations. Your job description just grew a new wing. You are no longer just a builder of digital infrastructure; you are now part financial planner, part supply chain expert, and part treaty negotiator.
Your playbook now includes:
FinOps literacy: The ability to connect design choices to money in a way the business understands and trusts.
Portability patterns: Designing services that can move without a complete rewrite.
Hybrid networking: Weaving together different environments without creating a haunted house of routing tables and DNS entries.
Observability without borders: Using vendor-neutral signals to see what’s happening from end to end.
Procurement fluency: The skill to make apples-to-apples comparisons between amortized hardware, managed services, and colocation contracts.
Yes, it’s time to carry a pocket calculator again, at least metaphorically.
The unsexy path to freedom
The journey back from the cloud is paved with unglamorous but essential work. It’s not a heroic epic; it’s a series of small, carefully planned steps. The risks are real. You have to account for the people cost of patching and maintaining private platforms, the lead times for hardware, and the shadow dependencies on convenient features you forgot you were using.
The antidote is small steps, honest metrics, and boringly detailed runbooks. Start with a proof-of-concept, create a migration plan that moves slices, not the whole cake, and have rollback criteria that a non-engineer can understand.
This is just a course correction
The Great Cloud Exit is less a rebellion and more a rationalization. Think of it as finally cleaning out your closet after a decade-long shopping spree. The public cloud gave us a phenomenal decade of speed, and we bought one of everything. Now, we’re sorting through the pile. That spiky, unpredictable web service? It still looks great in the elastic fabric of a hyperscaler. That massive, steady-state analytics database? It’s like a heavy wool coat that was never meant for the tropics; it’s time to move it to a more suitable climate, like your own data center. And that experimental service you spun up in 2019 and forgot about? That’s the impulse buy sequin jacket you’re never going to wear. Time to donate it.
Treating workload placement as a design problem instead of a loyalty test is liberating. It’s admitting you don’t need a Swiss Army knife when all you have to do is turn a single screw. Choosing the right environment for the job results in a system that costs less and complains less. It performs better because it’s not being forced to do something it was never designed for.
This leads to the most important outcome: options. In a landscape that changes faster than we can update our résumés, flexibility is the only superpower that truly matters. The ability to move, to adapt, and to choose without facing a punishing exit fee or a six-month rewrite, that’s the real prize. The cloud isn’t the destination anymore; it’s just one very useful stop on the map.
When Amazon started placing delivery lockers in neighborhoods, packages arrived faster and more reliably. Edge computing follows a similar logic, bringing computational power closer to the user. Instead of sending data halfway around the world, edge computing processes it locally, dramatically reducing latency, enhancing privacy, and maintaining autonomy.
For DevOps teams, this shift isn’t trivial. Like switching from central mail hubs to neighborhood lockers, it demands new strategies and skills.
CI/CD faces a new reality
Classic cloud pipelines are centralized, much like a single distribution center. Edge computing flips that model upside-down, scattering deployments across numerous tiny locations. Deploying updates to thousands of edge devices isn’t the same as updating a handful of cloud servers.
DevOps teams now battle version drift, a scenario similar to managing software on thousands of smartphones with different versions. The solutions? Smaller, incremental updates and lightweight build artifacts, ensuring that pushing changes doesn’t overwhelm limited network bandwidth or hardware resources.
Designing for when things go dark
Planning a family dinner knowing there’s a possibility of a power outage means stocking up on candles and sandwiches. Similarly, edge devices must be designed for disconnection, ensuring operations continue uninterrupted during network downtime.
Offline-first architectures become critical here. Techniques like local queuing and eventual data reconciliation help edge applications function seamlessly, even if connectivity is lost for hours or days. Managing schema migrations carefully is crucial; it’s akin to updating recipes without knowing if family members received the memo.
Keeping data consistently in sync
Imagine organizing a city-wide neighborhood watch: push notifications ensure quick alerts, while pull mechanisms periodically fetch updates. Edge deployments use similar synchronization tactics.
Techniques such as Conflict-Free Replicated Data Types (CRDTs) help manage data consistency, even when devices are offline or slow to respond. DevOps engineers also need to factor in bandwidth budgeting, using intelligent compression and prioritizing data to ensure crucial information reaches its destination promptly.
Observability without seeing everything
Monitoring edge deployments is like managing a fleet of food trucks spread across the city. You can’t constantly keep an eye on every truck. Instead, you rely on periodic check-ins and key signals.
Telemetry sampling, data aggregation at the edge, and effective back-pressure management prevent network floods. Selecting a few meaningful metrics, like checking a truck’s gas gauge rather than tracking every sandwich sold, helps quickly pinpoint issues without drowning in data.
Incident response across the edge
Responding to issues at thousands of remote locations is challenging, like troubleshooting vending machines scattered nationwide without direct access.
Edge incident response leverages runbook templates, policy-as-code, and remote diagnostics tools. Because traditional SSH access isn’t always viable, tactics like automated self-healing and structured escalation paths blending central SRE teams with local staff become indispensable.
Bridging cloud and edge
Integrating IoT devices into your infrastructure is similar to securely registering visitors at a large event, you need clear identification, managed credentials, and accurate headcounts.
Edge computing uses secure onboarding, rotating credentials, and message brokers that maintain state coherence across the network. Digital twins represent device states virtually, helping maintain consistent and accurate information between edge and cloud environments. Cost-effective strategies determine whether workloads run locally or in centralized clouds.
Preparing for what’s next
Edge computing evolves rapidly, with emerging standards like WebAssembly (WASM) running applications directly at the edge, and maturing tools like OpenTelemetry simplifying observability.
DevOps teams should embrace these changes early. Developing skills in hardware awareness and basic radio frequency (RF) knowledge becomes increasingly valuable. Experimenting now, rigorously measuring results, and sharing insights ensures teams stay ahead.
Innovate and adapt for the road ahead
Edge computing is reshaping DevOps in real-time. Thriving in this era requires adapting practices, tooling, and mindset. Bring your computational lockers closer to home, plan proactively for network disruptions, streamline synchronization, enhance remote observability, and respond intelligently to incidents.
By preparing today, your DevOps team can confidently navigate tomorrow’s distributed landscape. Embracing edge computing means more than just keeping pace with technology; it positions your team to deliver faster, more reliable services, capitalize on emerging business opportunities, and maintain a competitive advantage. Investing now in the right tools, processes, and skills not only safeguards against future challenges but also unlocks potential for innovation, growth, and sustained success in a rapidly evolving technological world.
In short, the future belongs to those who embrace change and adapt quickly; let your team be among them.
Running today’s software systems can feel a bit like trying to understand a bustling city from a helicopter high above. You see the general traffic flow, but figuring out why a specific street is jammed or where a particular delivery truck is going is tough. We have tools, of course, lots of them. But often, getting the detailed information we need means adding bulky agents or changing our applications, which can slow things down or create new problems. It’s a classic headache for anyone building or running software, whether you’re in DevOps, SRE, development, or architecture.
Wouldn’t it be nice if we had a way to get a closer look, right down at the street level, without actually disturbing the traffic? That’s essentially what eBPF lets us do. It’s a technology that’s been quietly brewing within the Linux kernel, and now it’s stepping into the spotlight, offering a new way to observe what’s happening inside our systems.
What makes eBPF special for watching systems
So, what’s the magic behind eBPF? Think of the Linux kernel as the fundamental operating system layer, the very foundation upon which all your applications run. It manages everything: network traffic, file access, process scheduling, you name it. Traditionally, peering deep inside the kernel was tricky, often requiring complex kernel module programming or using tools that could impact performance.
eBPF changes the game. It stands for Extended Berkeley Packet Filter, but it has grown far beyond just filtering network packets. It’s more like a tiny, super-efficient, and safe virtual machine right inside the kernel. We can write small programs that hook into specific kernel events, like when a network packet arrives, a file is opened, or a system call is made. When that event happens, our little eBPF program runs, gathers information, and sends it out for us to see.
Here’s why this is such a breakthrough for observability:
Deep Visibility Without the Weight: Because eBPF runs right in the kernel, it sees things with incredible clarity. It can capture detailed system events, network calls, and even hardware metrics. But crucially, it does this without needing heavy agents installed everywhere or requiring you to modify your application code (instrumentation). This low overhead is perfect for today’s complex distributed systems and microservice architectures where performance is key.
Seeing Things as They Happen: eBPF lets us tap into a live stream of data. We can track system calls, network flows, or function executions in real-time. This immediacy is fantastic for spotting anomalies or understanding performance issues the moment they arise, not minutes later when the logs finally catch up.
Tailor-made Views: You’re not stuck with generic, one-size-fits-all monitoring. Teams can write specific eBPF programs (often called probes or scripts) to look for exactly what matters to them. Need to understand a specific network interaction? Or figure out why a particular function is slow? You can craft an eBPF program for that. This allows plugging visibility gaps left by other tools and lets you integrate the data easily into systems you already use, like Prometheus or Grafana.
Seeing eBPF in action with practical examples
Alright, theory is nice, but where does the rubber meet the road? How are folks using eBPF to make their lives easier?
Untangling Distributed Systems: Microservices are great, but tracking a single user request as it bounces between dozens of services can be a nightmare. eBPF can trace these requests across service boundaries, directly observing the network calls and processing times at the kernel level. This helps pinpoint those elusive latency bottlenecks or failures that traditional tracing might miss.
Finding Performance Roadblocks: Is an application slow? Is the server overloaded? eBPF can help identify which processes are hogging CPU or memory, which disk operations are taking too long, or even optimize slow database queries by watching the underlying system interactions. It provides granular data to guide performance tuning efforts.
Looking Inside Containers and Kubernetes: Containers add another layer of abstraction. eBPF offers a powerful way to see inside containers and understand their interactions with the host kernel and each other, often without needing to install monitoring agents (sidecars) in every single pod. This simplifies observability in complex Kubernetes environments significantly.
Boosting Security: Observability isn’t just about performance; it’s also about security. eBPF can act like a security camera at the kernel level. It can detect unusual system calls, unauthorized network connections, or suspicious file access patterns in real-time, providing an early warning system against potential threats.
Who is using this cool technology?
This isn’t just a theoretical tool; major players are already relying on eBPF.
Big Tech and SaaS Companies: Giants like Meta and Google use eBPF extensively to monitor their vast fleets of microservices and optimize performance within their massive data centers. They need efficiency and deep visibility, and eBPF delivers.
Financial Institutions: The finance world needs speed, reliability, and security. They’re using eBPF for real-time fraud detection by monitoring system behavior and ensuring compliance by having a clear audit trail of system activities.
Online Retailers: Imagine the traffic surge during an event like Black Friday. E-commerce platforms leverage eBPF to keep their systems running smoothly under extreme load, quickly identifying and resolving bottlenecks to ensure customers have a good experience.
Where is eBPF headed next?
The journey for eBPF is far from over. We’re seeing exciting developments:
Playing Nicer with Others: Integration with standards like OpenTelemetry is making it easier to adopt eBPF. OpenTelemetry aims to standardize how we collect and export telemetry data (metrics, logs, traces), and eBPF fits perfectly into this picture as a powerful data source. This helps create a more unified observability landscape.
Beyond Linux: While born in Linux, the core ideas and benefits of eBPF are inspiring similar approaches in other areas. We’re starting to see explorations into using eBPF concepts for networking hardware, IoT devices, and even helping understand the performance of AI applications.
A new lens on systems
So, eBPF is shaping up to be more than just another tool in the toolbox. It offers a fundamentally different approach to understanding our increasingly complex systems. By providing deep, low-impact, real-time visibility right from the kernel, it empowers DevOps teams, SREs, developers, and architects to build, run, and secure modern applications more effectively. It lets us move from guessing to knowing, turning those opaque system internals into something we can finally observe clearly. It’s definitely a technology worth watching and maybe even trying out yourself.
You know, for a long time, Enterprise Architecture, or EA, felt a bit like map-making after the explorers had already come back. People drew intricate diagrams of how things were or how they should be, often locked away in tools only a few knew how to use. It was important work, sure, but sometimes it felt disconnected from the fast-paced world of building and running software, especially in the cloud and DevOps realms where things change by the minute.
But something interesting has been happening. EA is shedding its old skin. It’s moving away from being a static blueprint repository and becoming more like a dynamic, living navigation system for the business. And the fuel for this new system? Data. Lots of it. This shift makes EA incredibly relevant and much more exciting for those of us knee-deep in DevOps, SRE, and Cloud Architecture. Let’s explore how this data-driven approach isn’t just a new coat of paint for EA but a powerful engine for building and operating systems today.
Real-time data is king, so no more stale maps
Think about driving using a paper map printed last year versus using a live GPS app. Which one do you trust when navigating rush hour traffic? It’s the same with system architecture. Decisions based on diagrams updated manually months ago, or worse, on someone’s gut feeling, just don’t cut it anymore.
The new approach insists on using live data. This means tapping directly into the sources of truth through APIs and integrations. We’re talking about pulling information from your cloud provider, your monitoring systems (think Prometheus, Datadog, Dynatrace), your CI/CD pipelines, your configuration management databases (CMDBs), and even your code repositories.
Why is this such a big deal for DevOps and Cloud folks? Because it mirrors exactly what we strive for with observability. We need real-time insights into system health, performance, and dependencies to operate effectively. When EA leverages the same live data streams, it stops being a theoretical exercise and starts reflecting the actual, breathing state of our complex, distributed systems. Imagine architectural diagrams that automatically update when a new service is deployed via your pipeline or that highlight dependencies based on real network traffic observed by your monitoring tools. That’s moving from a stale map to a live GPS.
Turning data noise into strategic signals
Okay, so we hook everything up and get data flowing. Great! But now we risk drowning in it. A flood of metrics and logs isn’t useful on its own; it can just be noise. The real magic happens when we turn that raw data into insights and those insights into action.
This is where smart visualizations and context-aware dashboards come into play. Instead of presenting architects or DevOps teams with a giant spreadsheet of everything, the idea is to show the right information to the right people at the right time. Think dashboards tailored to specific business capabilities, showing not just CPU usage but how application performance impacts user experience or conversion rates. Or tools that use algorithms to automatically detect anomalies or predict potential bottlenecks based on current trends.
There’s even a fascinating concept emerging called a “Digital Twin of an Organization” or DTO. Don’t let the fancy name scare you. Think of it as a sophisticated simulation or model of your systems and processes built on real data. It allows you to ask “what if” questions. What happens if we migrate this database? What’s the impact of doubling traffic to this service? It’s like having a virtual sandbox, informed by reality, to test changes and understand complex interdependencies before touching production. For SREs and architects managing intricate cloud environments, being able to model changes and predict outcomes is incredibly powerful – it helps us navigate complexity and reduce risk.
The automation and AI advantage freeing up brainpower
Now, collecting all this data, analyzing it, and keeping models updated sounds like a ton of work. And it would be if done manually. This is where automation becomes essential.
Much like we use Infrastructure as Code (IaC) tools (like Terraform or Pulumi) to automate infrastructure provisioning or CI/CD pipelines to automate testing and deployment, modern EA relies heavily on automation. Automating data collection from various sources is just the start. We can automate the generation of visualizations, the detection of architectural drift (when the reality no longer matches the intended design), and even basic consistency checks against predefined architectural principles or security standards.
And Artificial Intelligence (AI) is starting to play a role too. AI can help make sense of unstructured data (like text in design documents), identify complex patterns in operational data that humans might miss (hello, AIOps!), and even suggest improvements or refactoring options for system designs.
The goal here isn’t to replace architects or engineers. It’s the same goal as in DevOps automation: to handle the repetitive, time-consuming, and error-prone tasks so that humans can focus their valuable brainpower on the more strategic, creative, and complex challenges. It frees people up to think about higher-level design, innovation, and solving tricky business problems.
Why this matters to you
So, why should you, as a DevOps engineer, SRE, or Cloud Architect, care about these shifts in EA?
Because this data-driven, automated approach bridges the gap that often existed between architecture and operations.
Faster, Better Decisions: When architecture is based on the same live data you use for monitoring and troubleshooting, decisions about scaling, resilience, or refactoring become much more informed and timely.
Reduced Friction: It breaks down silos. Architects understand the operational reality better, and Ops/Dev teams get clearer guidance rooted in that reality. Collaboration improves naturally.
Proactive Problem Solving: By analyzing trends and modeling changes (like with a DTO), you can move from reactive firefighting to proactively identifying and mitigating risks or performance issues.
Improved Alignment: It helps ensure that the systems we build and run are truly aligned with business goals, using metrics that matter to the business, not just technical metrics.
Efficiency: Automation handles the grunt work, letting you focus on more interesting and impactful problems.
Essentially, this evolution of EA makes the architect’s work more grounded, more dynamic, and more directly supportive of the goals we pursue in DevOps and Cloud environments – building resilient, scalable, and efficient systems that deliver value quickly.
Embracing a smarter architecture
The world of Enterprise Architecture is changing. It’s becoming less about static drawings and rigid governance and more about leveraging real-time data, insightful analytics, and smart automation. It’s becoming a living, breathing part of the technology ecosystem.
For those of us working in DevOps and the Cloud, this is fantastic news. It means EA is speaking our language, using the data we rely on, and adopting the automation principles we champion. It’s becoming a powerful ally in our quest to build and operate better systems. Letting data steer the ship isn’t just a new rule for architects; it’s a smarter way for all of us to navigate the complexities of modern technology.
Sometimes, you’re working with Kubernetes, orchestrating your containers like a maestro, and suddenly, one of your Pods throws a tantrum. It enters the dreaded CrashLoopBackOff state. You check the logs, hoping for a clue, a breadcrumb trail leading to the culprit, but… nothing. Silence. It feels like the Pod is crashing so fast it doesn’t even have time to whisper why. Frustrating, right? Many of us in the DevOps, SRE, and development world have been there. It’s like trying to solve a mystery where the main witness disappears before saying a word.
But don’t despair! This CrashLoopBackOff status isn’t just Kubernetes being difficult. It’s a signal. It tells us Kubernetes is trying to run your container, but the container keeps stopping almost immediately after starting. Kubernetes, being persistent, waits a bit (that’s the “BackOff” part) and tries again, entering a loop of crash-wait-restart-crash. Our job is to break this loop by figuring out why the container won’t stay running. Let’s put on our detective hats and explore the common reasons and how to investigate them.
Starting the investigation. What Kubernetes tells us
Before diving deep, let’s ask Kubernetes itself what it knows. The describe command is often our first and most valuable tool. It gives us a broader picture than just the logs.
kubectl describe pod <your-pod-name> -n <your-namespace>
Don’t just glance at the output. Look closely at these sections:
State: It will likely show Waiting with the reason CrashLoopBackOff. But look at the Last State. What was the state before it crashed? Did it have an Exit Code? This code is a crucial clue! We’ll talk more about specific codes soon.
Restart Count: A high number confirms the container is stuck in the crash loop.
Events: This section is pure gold. Scroll down and read the events chronologically. Kubernetes logs significant happenings here. You might see errors pulling the image (ErrImagePull, ImagePullBackOff), problems mounting volumes, failures in scheduling, or maybe even messages about health checks failing. Sometimes, the reason is right there in the events!
Chasing ghosts. Checking previous logs
Okay, so the current logs are empty. But what about the logs from the previous attempt just before it crashed? If the container managed to run for even a fraction of a second and log something, we might catch it using the –previous flag.
It’s a long shot sometimes, especially if the crash is instantaneous, but it costs nothing to try and can occasionally yield the exact error message you need.
Are the health checks too healthy?
Liveness and Readiness probes are fantastic tools. They help Kubernetes know if your application is truly ready to serve traffic or if it’s become unresponsive and needs a restart. But what if the probes themselves are the problem?
Too Aggressive: Maybe the initialDelaySeconds is too short, and the probe checks before your app is even initialized, causing Kubernetes to kill it prematurely.
Wrong Endpoint or Port: A simple typo in the path or port means the probe will always fail.
Resource Starvation: If the probe endpoint requires significant resources to respond, and the container is resource-constrained, the probe might time out.
Check your Deployment or Pod definition YAML for livenessProbe and readinessProbe sections.
# Example Probe Definition
livenessProbe:
  httpGet:
    path: /heaalth # Is this path correct?
    port: 8780     # Is this the right port?
  initialDelaySeconds: 15 # Is this long enough for startup?
  periodSeconds: 10
  timeoutSeconds: 3     # Is the app responding within 3 seconds?
  failureThreshold: 3
If you suspect the probes, a good debugging step is to temporarily remove or comment them out.
Find the livenessProbe and readinessProbe sections within the container spec and comment them out (add # at the beginning of each line) or delete them.
Save and close the editor. Kubernetes will trigger a rolling update.
Observe the new Pods. If they run without crashing now, you’ve found your culprit! Now you need to fix the probe configuration (adjust delays, timeouts, paths, ports) or figure out why your application isn’t responding correctly to the probes and then re-enable them. Don’t leave probes disabled in production!
Decoding the Exit codes reveals the container’s last words
Remember the exit code we saw in kubectl? Can you describe the pod under Last State? These numbers aren’t random; they often tell a story. Here are some common ones:
Exit Code 0: Everything finished successfully. You usually won’t see this with CrashLoopBackOff, as that implies failure. If you do, it might mean your container’s main process finished its job and exited, but Kubernetes expected it to keep running (like a web server). Maybe you need a different kind of workload (like a Job) or need to adjust your container’s command to keep it running.
Exit Code 1: A generic, unspecified application error. This usually means the application itself caught an error and decided to terminate. You’ll need to look inside the application’s code or logic.
Exit Code 137 (128 + 9): This often means the container was killed by the system due to using too much memory (OOMKilled – Out Of Memory). The operating system sends a SIGKILL signal (which is signal number 9).
Exit Code 139 (128 + 11): Segmentation Fault. The container tried to access memory it shouldn’t have. This is usually a bug within the application itself or its dependencies.
Exit Code 143 (128 + 15): The container received a SIGTERM signal (signal 15) and terminated gracefully. This might happen during a normal shutdown process initiated by Kubernetes, but if it leads to CrashLoopBackOff, perhaps the application isn’t handling SIGTERM correctly or something external is repeatedly telling it to stop.
Exit Code 255: An exit status outside the standard 0-254 range, often indicating an application error occurred before it could even set a specific exit code.
Exit Code 137 is particularly common in CrashLoopBackOff scenarios. Let’s look closer at that.
Running out of breath resource limits
Modern applications can be memory-hungry. Kubernetes allows you to set resource requests (what the Pod wants) and limits (the absolute maximum it can use). If your container tries to exceed its memory limit, the Linux kernel’s OOM Killer steps in and terminates the process, resulting in that Exit Code 137.
Check the resources section in your Pod/Deployment definition:
# Example Resource Definition
resources:
  requests:
    memory: "128Mi" # How much memory it asks for initially
    cpu: "250m"     # How much CPU it asks for initially (m = millicores)
  limits:
    memory: "256Mi" # The maximum memory it's allowed to use
    cpu: "500m"     # The maximum CPU it's allowed to use
If you suspect an OOM kill (Exit Code 137 or events mentioning OOMKilled):
Check Limits: Are the limits set too low for what the application actually needs?
Increase Limits: Try carefully increasing the memory limit. Edit the deployment (kubectl edit deployment…) and raise the limits. Observe if the crashes stop. Be mindful not to set limits too high across many pods, as this can exhaust node resources.
Profile Application: The long-term solution might be to profile your application to understand its memory usage and optimize it or fix memory leaks.
Insufficient CPU limits can also cause problems (like extreme slowness leading to probe timeouts), but memory limits are a more frequent direct cause of crashes via OOMKilled.
Is the recipe wrong? Image and configuration issues
Sometimes, the problem happens before the application code even starts running.
Bad Image: Is the container image name and tag correct? Does the image exist in the registry? Is it built for the correct architecture (e.g., trying to run an amd64 image on an arm64 node)? Check the Events in kubectl describe pod for image-related errors (ErrImagePull, ImagePullBackOff). Try pulling and running the image locally to verify:
docker pull <your-image-name>:<tag>
docker run --rm <your-image-name>:<tag>
Configuration Errors: Modern apps rely heavily on configuration passed via environment variables or mounted files (ConfigMaps, Secrets).
.- Is a critical environment variable missing or incorrect?
.- Is the application trying to read a file from a ConfigMap or Secret volume that doesn’t exist or hasn’t been mounted correctly?
.- Are file permissions preventing the container user from reading necessary config files?
Check your deployment YAML for env, envFrom, volumeMounts, and volumes sections. Ensure referenced ConfigMaps and Secrets exist in the correct namespace (kubectl get configmap <map-name> -n <namespace>, kubectl get secret <secret-name> -n <namespace>).
Keeping the container alive for questioning
What if the container crashes so fast that none of the above helps? We need a way to keep it alive long enough to poke around inside. We can tell Kubernetes to run a different command when the container starts, overriding its default entrypoint/command with something that doesn’t exit, like sleep.
Find the containers section and add a command and args field to override the container’s default startup process:
# Inside the containers: array
- name: <your-container-name>
  image: <your-image-name>:<tag>
  # Add these lines:
  command: [ "sleep" ]
  args: [ "infinity" ] # Or "3600" for an hour, etc.
  # ... rest of your container spec (ports, env, resources, volumeMounts)
(Note: Some base images might not have sleep infinity; you might need sleep 3600 or similar)
Save the changes. A new Pod should start. Since it’s just sleeping, it shouldn’t crash.
Now that the container is running (even if it’s doing nothing useful), you can use kubectl exec to get a shell inside it:
kubectl exec -it <your-new-pod-name> -n <your-namespace> -- /bin/sh
# Or maybe /bin/bash if sh isn't available
Once inside:
Check Environment: Run env to see all environment variables. Are they correct?
Check Files: Navigate (cd, ls) to where config files should be mounted. Are they there? Can you read them (cat <filename>)? Check permissions (ls -l).
Manual Startup: Try to run the application’s original startup command manually from the shell. Observe the output directly. Does it print an error message now? This is often the most direct way to find the root cause.
Remember to remove the command and args override from your deployment once you’ve finished debugging!
The power of kubectl debug
There’s an even more modern way to achieve something similar without modifying the deployment directly: kubectl debug. This command can create a copy of your crashing pod or attach a new “ephemeral” container to the running (or even failed) pod’s node, sharing its process namespace.
A common use case is to create a copy of the pod but override its command, similar to the sleep trick:
kubectl debug pod/<your-pod-name> -n <your-namespace> --copy-to=debug-pod --set-image='*' --share-processes -- /bin/sh
# This creates a new pod named 'debug-pod', using the same spec but running sh instead of the original command
Or you can attach a debugging container (like busybox, which has lots of utilities) to the node where your pod is running, allowing you to inspect the environment from the outside:
kubectl debug node/<node-name-where-pod-runs> -it --image=busybox
# Once attached to the node, you might need tools like 'crictl' to inspect containers directly
kubectl debug is powerful and flexible, definitely worth exploring in the Kubernetes documentation.
Don’t forget the basics node and cluster health
While less common, sometimes the issue isn’t the Pod itself but the underlying infrastructure.
Node Health: Is the node where the Pod is scheduled healthy? kubectl get nodes
# Check the STATUS. Is it 'Ready'?
kubectl describe node <node-name>
# Look for Conditions (like MemoryPressure, DiskPressure) and Events at the node level.
Cluster Events: Are there broader cluster issues happening? kubectl get events -n <your-namespace>
kubectl get events --all-namespaces # Check everywhere
Wrapping up the investigation
Dealing with CrashLoopBackOff without logs can feel like navigating in the dark, but it’s usually solvable with a systematic approach. Start with kubectl describe, check previous logs, scrutinize your probes and configuration, understand the exit codes (especially OOM kills), and don’t hesitate to use techniques like overriding the entrypoint or kubectl debug to get inside the container for a closer look.
Most often, the culprit is a configuration error, a resource limit that’s too tight, a faulty health check, or simply an application bug that manifests immediately on startup. By patiently working through these possibilities, you can unravel the mystery and get your Pods back to a healthy, running state.