
Blog NivelEpsilon

Making Kubernetes upgrades boring on purpose

The email always arrives in the same tone, the calm and faintly apologetic voice of a notary reading a will. Your Kubernetes version, it says, will soon reach the end of standard support. Nobody has died yet. But the cluster has started looking at you the way an elderly Labrador looks at the car when it suspects the destination is the vet.

Kubernetes ships three minor releases a year, and managed providers support each one for roughly fourteen months. That gives your cluster about the shelf life of a yogurt with ambitions. On EKS, ignoring the expiry date does not break anything, it just gets expensive. Clusters roll into extended support by default, and the control plane goes from $0.10 to $0.60 per hour, six times the price for the privilege of postponing a decision you will have to make anyway. Procrastination, it turns out, has an hourly rate.

Large companies handle this ritual with platform teams the size of a small village. You have three people, a backlog with its own gravitational field, and a production environment that nobody fully remembers configuring. Upgrading means touching the control plane, the nodes, the controllers, and the workloads, all while the patient is awake and serving traffic.

So let us be clear about the goal. This is not about heroism. In operations, heroism is a polite word for someone losing sleep. The goal is to make upgrades so boring, so predictable and so reversible that nobody mentions them at lunch the following week. Think of it as elective surgery, scheduled, rehearsed, and performed by people who have read the patient’s chart.

Kubernetes rarely kills anyone directly

When an upgrade goes wrong, Kubernetes itself is almost never the murderer. It is more like the host of a dinner party where something in the soup disagreed with the guests. The real culprits are the things you bolted onto it over the years.

The classic case is the ingress controller that flatlines the moment the upgrade finishes. It was quietly relying on networking.k8s.io/v1beta1, an API version Kubernetes deprecated years earlier and finally removed in 1.22. Nobody noticed because nothing broke, until everything did. PodSecurityPolicy pulled the same trick in 1.25, leaving like a houseguest who sneaks out before breakfast and takes your security model with them.

Then there is Helm, which keeps the rendered manifests of every release the way some people keep old love letters. If those manifests reference an API that no longer exists, your next helm upgrade fails, even when the new chart is perfectly modern. The helm-mapkubeapis plugin exists precisely to clean up this kind of sentimental clutter.

Add a service mesh with its own compatibility matrix (Istio publishes the Kubernetes versions each release supports, and it means it), stateful workloads that panic when a node vanishes, and version skew between the control plane and the nodes, and the pattern becomes obvious. Most upgrade incidents are dependency failures wearing a Kubernetes trench coat.

Taking the patient’s medical history

No surgeon operates on a stranger. Before you touch anything, write down what is really inside the cluster, which is rarely what the architecture diagram claims.

The list does not need to be elegant. It needs your current and target versions, the OS images on every node pool, and every add-on, CRD, and operator, including the one someone installed during an incident in 2022 and never mentioned again. Note the critical workloads and the humans who own them, because at 3 a.m. “the payments team” is not a phone number. Record the external dependencies too, from databases to DNS to the identity provider whose webhook will suddenly matter a great deal if it stops answering.

Keep this inventory in Git, next to the code. It becomes the baseline for the next upgrade and the one after that. The second upgrade should be cheaper than the first. If it is not, the inventory was a diary entry rather than a medical chart.

Hunting for the APIs nobody admits to using

Production should never be the first place you test a theory. Before the upgrade, scan for deprecated and removed APIs in your manifests, your Kustomize overlays, your Helm releases, and the resources your CI pipeline generates, which nobody has read since the day they were written. A few commands go a long way.

# Deprecated APIs in manifests and Helm releases
pluto detect-files -d ./manifests
pluto detect-helm -owide

# What is running in the cluster right now
kubent

# Which clients are still calling deprecated APIs
kubectl get --raw /metrics | grep apiserver_requested_deprecated_apis

The last one is the most honest of the group. It asks the API server who is still calling deprecated endpoints, which catches things that live outside Git, like a forgotten CronJob or a vendor operator with outdated opinions.

The cloud providers will help too, each with its own temperament. EKS upgrade insights flags readiness problems before you press the button. GKE surfaces deprecation insights and tells you which versions your release channel offers. AKS is strict about the version skew it allows between the control plane and node pools, and its rules are worth reading before you plan the sequence rather than halfway through it.

A backup you have never restored is a bedtime story

Backups belong before the surgery, not after it. A backup you have never restored is a story you tell yourself so you can fall asleep, and like most bedtime stories, it contains no useful information about what happens when the lights go out.

Think in three layers. The first is your GitOps repositories and infrastructure as code, which describe what the cluster should look like. The second is the cluster’s own configuration (RBAC, network policies, operator settings, and the custom resources that never quite made it into Git). The third is the application data, persistent volumes included, which is the only layer your customers care about.

Tools like Velero cover the second and third layers well, but owning a tool is not the test. The test is restoring into a scratch cluster and timing it. Do it every quarter and before any upgrade that touches stateful workloads. “We have snapshots” is a feeling. “We can restore the orders database in 40 minutes” is a plan.

The operation, in five uneventful acts

Upgrading everything at once is a reliable way to end up on a 3 a.m. call with a dozen people, a shared screen, and no idea which change started the fire. Doing it in phases keeps the blast radius small and the call list short.

Pre-op paperwork

Check your quotas and your IP address capacity. Surge upgrades and new node pools need room, and a subnet with no free addresses will stall an upgrade more efficiently than any bug. Freeze nonessential deployments. Then write down, before you start, what success looks like and which specific signal will make you stop. Abort criteria decided in advance are engineering. Abort criteria decided during the incident are a negotiation.

Practicing on the cadaver

Medical students learn on cadavers because cadavers do not file complaints. Your staging cluster plays the same role. Upgrade it first, run the integration tests, and let it soak for a defined period. Every manual tweak you needed is a bug in your process, so write it down and automate it before production. If staging is so different from production that a clean run proves nothing, congratulations, you have found next quarter’s real project.

Brain surgery, performed by someone else

The control plane upgrade is the one part of the operation where the cloud provider holds the scalpel, and you hold the patient’s hand. You move one minor version at a time, and on the major managed services you rarely get a say in the matter, since they will not let you skip ahead. It is one of the few occasions when a vendor protects you from your own optimism.

Leave the node pools on the old version while the control plane changes. The upstream skew policy allows kubelets to run up to three minor versions behind the API server, so a patient can live for a while with a new brain and old limbs. The opposite arrangement, nodes newer than the control plane, is not supported at all.

The organ transplant

Node upgrades are where availability really gets tested, because you are dismantling the machines your code is running on. For simple stateless workloads, a surge upgrade is fine: add a new node, drain an old one, repeat. For anything critical, create a fresh node pool on the target version and move workloads across deliberately. GKE offers blue-green node pool upgrades out of the box, and AKS recommends going control plane first, then system node pools, then user node pools.

Do the transplant in stages. Move your least important background jobs to the new pool first and watch them like a nervous parent at a school play. Are error rates stable? Is scheduling behaving? Are the pods starting at all? Only then move critical workloads, in batches.

None of this works without PodDisruptionBudgets, readiness probes, and graceful shutdown. PDBs, however, have a dark side. A budget that allows zero disruptions does not protect your service, it takes the upgrade hostage, and each provider handles hostages differently. GKE respects PDBs for up to an hour during a surge upgrade and then evicts the remaining pods by force. EKS managed node groups wait 15 minutes and then fail the upgrade with a PodEvictionFailure error unless you pass the force flag. Neither ending is what you had in mind when you wrote that PDB.

Physical therapy for the add-ons

Once the core is done, move on to CoreDNS, the CNI, the ingress controller, cert-manager and the service mesh, one at a time, each checked against its own compatibility notes. Ship application changes separately from infrastructure changes. If two things change at once and something breaks, you will spend the afternoon running a paternity test instead of fixing the problem.

The seven-day return policy

For years, rolling back a managed control plane was mostly wishful thinking. Upstream Kubernetes does not support it natively, so teams paid for reversibility with duplicate clusters or elaborate snapshots of cluster state.

That changed this summer. In July 2026, AWS launched EKS Version Rollback, which lets you return the control plane to the previous minor version within seven days of an upgrade. It goes back one minor version at a time, and before starting it runs rollback readiness insights that check API compatibility, version skew, add-ons, and cluster health. GKE has offered control plane minor version rollback since 1.33, while AKS limits rollback to node pools.

Two caveats keep this from being a get-out-of-jail-free card. The first is the clock. If your plan is to watch production for ten days before declaring victory, the safety net disappears on day seven, so fit your observation window inside it. The second is scope. Only the control plane goes back. Your database migrations, the CRDs an operator already converted, and the data written in the meantime all stay exactly where they are. A rollback undoes the surgery, not the meals the patient has eaten since.

Let the robots drain, let the humans sign

Small teams survive by automating the boring parts, such as version compatibility checks, health polling, node draining and post-upgrade smoke tests. Machines are excellent at doing the same tedious thing the same way every time, which is more than anyone can say for an engineer on their fourth coffee.

What should not be automated is judgment. A human approves the production control plane upgrade. A human approves deleting the old node pools, which is the exact moment your fallback stops existing. A human decides any rollback that involves stateful data. Automate the labor, but keep a person on the consent form.

A runbook you can read while panicking

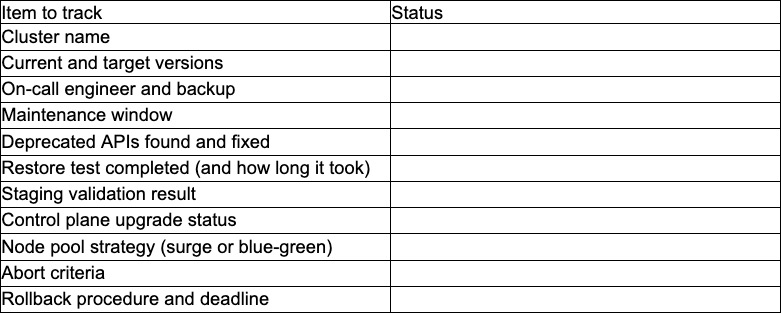
Upgrade documentation should be short enough to read with your heart rate at 140. If it reads like a novel, nobody will open it during the incident. Here is a one-page template you are welcome to steal.

The best upgrade is the one nobody remembers

Upgrading Kubernetes does not have to be traumatic. Move one minor version at a time, take your dependencies more seriously than Kubernetes itself, rehearse on staging, and treat any backup you have not restored with the suspicion it deserves.

Do that a few times and something strange happens. The notary’s email arrives, someone opens a ticket, the runbook gets filled in, and a week later nobody can quite remember when the upgrade happened. In operations, that kind of amnesia is the highest compliment there is.

Cloud Run finally adopted an insomniac

My AI agent hung up on me after exactly five minutes. It did not wait for four minutes, nor did it stretch to six. The line went dead at five minutes flat, displaying the sterile punctuality of a scheduled dental cleaning and the interpersonal warmth of a parking meter. I reconnected. Five minutes later, another hang-up. I reconnected yet again, driven by that specific primate delusion that makes humans violently mash an elevator button that is already glowing. Five minutes.

This is the clinical record of how that aggressively rude disconnection finally explained to me why Google issued a fourth child to the Cloud Run family, and why this particular infant absolutely refuses to go to bed.

A family that already reached maximum occupancy

Cloud Run is the designated quarantine zone where most of my experiments go to live, especially the ones involving artificial intelligence workloads. Therefore, when Google announced Cloud Run instances in preview, my initial reaction was not one of boundless joy. It was the haunted expression of an exhausted parent being told that yet another sibling is on the way. Cloud Run already possessed three execution models, and they seemed to cover every conceivable household chore:

  • Services, the aggressively sociable one. This sibling greets every single visitor, answers every request, and drops into a deep coma the exact millisecond the last guest leaves the living room. The marketing brochure politely refers to this narcolepsy as “scaling to zero.”
  • Jobs, the brooding teenager who shows up, runs a five-hour load of heavy laundry, and departs without saying goodbye or making eye contact.
  • Worker Pools, the subterranean dweller. It lives in the basement, quietly pulls tasks from a queue, and possesses no public URL. Nobody has its phone number. Nobody asks how its day went.

Why did we need a fourth? What bizarre task could this new arrival possibly execute that the other three could not handle between them?

(A brief warning about vocabulary before we proceed. Cloud Run already utilized the word “instance” for the container copies a Service spins up when it scales. Now there is a separate product officially named Cloud Run instances. This linguistic choice means the sentence “my instance ran out of instances” is now grammatically valid. Sooner or later someone will say this in a corporate meeting with a completely straight face. For our purposes, “Instance” with a capital I refers to the new product. When in doubt during your daily life, ask the speaker which instance they mean. Then ask them again just to be safe.)

The experiment that worked and explained absolutely nothing

My plan was to find the justification for this new product empirically. I would build an AI agent that runs long-lived sessions and keeps temporary data locally, deploy it as a regular Cloud Run Service, and watch it fail spectacularly. The failure would reveal the true purpose of Instances.

I mounted a Cloud Storage bucket as a volume and gave the agent a tool to read and write its session state there. I added an ephemeral disk for the scratch data it produced mid-task. Then I sat back and waited for the disaster.

Disaster did not come. The agent handled long sessions without complaint. It scaled to zero when ignored, costing me nothing, and when I called it later it picked up the exact same session as if it had just stepped out for a coffee. Scientifically speaking, this was the worst possible outcome. A total success without any comprehension of the underlying mechanics is just a failure with an excellent public relations team.

Of course, the setup was deeply flawed. Cloud Storage mounted through FUSE (Filesystem in Userspace) is less like a modern hard drive and more like trying to maintain a deep, philosophical conversation by sending telegrams via carrier pigeons with bad attitudes. The latency is palpable, and real POSIX file locking is completely off the menu. The ephemeral disk, meanwhile, was wiped completely clean every time the service scaled to zero. It was like hiring an overzealous sanitation team that incinerates your filing cabinets the moment you step out for a bathroom break.

But here is the catch. None of those problems justified the new Instances product, because an Instance would suffer from the exact same storage limitations. My confusion had metastasized into a peer-reviewed finding.

The waiter who violently confiscates your plate

The breakthrough arrived when I stopped thinking of agents as people who mail letters and started thinking of them as people who make phone calls.

Request and response is letter writing. A question goes out, an answer comes back, and the mailbox goes quiet. That is the natural habitat of a Cloud Run Service. But many long-running agents do not write letters. They open a WebSocket and keep it perpetually open, pushing a steady trickle of updates back to the user. That is a phone call meant to stay active for hours.

When I rebuilt my agent using this methodology, I met the five-minute hang-up from the first paragraph. The culprit was the request timeout. On a Cloud Run Service, a WebSocket connection is treated as a standard request, and every request has a deadline. You can stretch this maximum timeout to 60 minutes. To a long-running AI agent, sixty minutes is equivalent to a waiter staring unblinkingly into your eyes while ripping the plate from your hands and charging you for the privilege of not swallowing your food.

This is precisely the gap Cloud Run instances fill. Unlike Cloud Run services that scale based on incoming traffic, an Instance is a dedicated compute container managed manually through lifecycle transitions (create, stop, start, update, delete). It gets an HTTPS address that survives updates and restarts. It holds connections open. It does not suffer from narcolepsy when traffic stops. It is the insomniac cousin who always picks up the phone at three in the morning.

Creating one requires a single beta command. Just remember to keep IAM invoker authentication enabled. Bypassing IAM is fine for a quick demo, but for an AI agent with access to your calendar and inbox, you probably do not want it casually chatting with the entire internet.

What the insomniac actually does for a living

Long-running AI agents got me through the door, but they are not the only tenants suited for this environment.

Personal agents and workflow engines. If I run an automation tool like n8n or a personal agent for myself, I do not need it to scale to a thousand users. I need it awake, holding its state, and reachable at a stable URL that refuses to hang up after an hour. This is the flagship use case.

A quick bastion host. Giving developers access to a private database usually requires provisioning a Virtual Machine and babysitting SSH keys, which is the IT equivalent of building a dedicated two-story garage just to store a single garden rake. Now, developers can use Instances as bastion hosts to reach internal resources. Just check the current documentation, because SSH access for this preview product changes rapidly.

Sandboxes and code playgrounds. Sometimes you just need an addressable box to execute code you do not entirely trust, a playground you fully intend to delete next week. Pair an Instance with Cloud Run sandboxes, and you get that environment without standing up a massive Kubernetes cluster.

The argument for Instances is not raw capability. A dedicated Virtual Machine can do all of this. The argument is convenience and price. Running an Instance with 1 vCPU and 1 GiB of memory continuously for a month costs around $5.70. Unlike a vending machine sandwich of the exact same price, this compute container will not give you severe heartburn, though its absolute lack of local persistent storage might cause a mild nervous breakdown. The insomniac does its own laundry, saving you from patching operating systems or provisioning HTTPS endpoints.

The fine print, read aloud in a clinical setting

Every adoption comes with paperwork. Here is the part of the file the agency hoped you would not read.

It is a goldfish. An Instance is a singleton with zero autoscaling. It is cheap and low maintenance, but if you overfeed it, it floats belly-up. When your app gets a sudden spike in traffic, Cloud Run will not spin up a helpful sibling. Requests will queue politely until they quietly die of old age. Internet users love to tap on the server glass until the poor fish suffers a fatal HTTP-induced collapse. Keep IAM authentication turned on so strangers cannot overfeed a goldfish they cannot reach.

It has nowhere safe to keep its things. An Instance feels like a VM, but it has no local persistent disk. Anything written to the temporary folder lives in the container’s memory, so your scratch files compete directly with your application for RAM. It is like storing your weekly groceries in your jacket pockets.

It suffers from weekly amnesia. Instances can stay active for up to seven days before a mandatory restart policy kicks in. When that happens, everything in memory and on the ephemeral disk is instantly vaporized. Think of a corporate office worker who suffers a blunt-force head trauma every Sunday at midnight. They show up on Monday morning smiling, with their tie on backward, having absolutely no recollection of their own name, waiting for an external database to explain who they are. Anything that must survive this reboot belongs in a bucket.

It is still in preview. Running production workloads on a preview product is not strictly forbidden. It is just the infrastructure version of moving your living room furniture into a house while the construction crew is actively sawing the legs off the staircase.

A Field Guide to the Cloud Run Household

By the end of my investigation, the entire Cloud Run family finally made clinical sense. Since tables tend to break when viewed on mobile phones, think of this as a highly practical survival guide for your next architectural decision:

  • The Service: Reach for this when you need a web app or API that scales massively with traffic and takes a nap when idle.
  • The Job: Reach for this when you have a batch task that runs for hours and then permanently clocks out.
  • The Worker Pool: Reach for this when you need background workers pulling from a queue, hiding safely from the public internet.
  • The Instance: Reach for this when you need one always-on container with a stable URL that holds connections for days without hanging up.

The first three members of the family were built around the very reasonable idea that you should not pay for a machine that is not actively working. The new sibling is built around a different, equally reasonable idea: some things are only useful if they are completely awake when you call them.

So yes, Cloud Run adopted an insomniac. It costs about as much as a sad sandwich, it answers the phone at any hour, it violently forgets its own identity once a week, and it will panic if more than a handful of people speak to it simultaneously. I have worked with human beings exactly like that. Some of them were excellent colleagues.

Just remember, when you tell your team you are “moving the agent to an instance,” clarify exactly which instance you mean. Then clarify it again, just to be safe.

Tricking Terraform to test your infrastructure locally in seconds

There is a very specific type of agony associated with waiting for cloud resources to spin up. You write your infrastructure code, you push it to the server, you stare at a loading spinner, and you visibly age. By the time your database is finally ready to accept connections, you have completely forgotten why you needed a database in the first place.

Real infrastructure lives in Terraform. If local development is going to be genuinely useful to us, it needs to speak that exact same language. But we do not want to wait, and we certainly do not want to pay Jeff Bezos every time we run a unit test.

The solution is an elaborate digital heist. We are going to put a pair of virtual reality goggles on Terraform so it believes it is negotiating with the almighty AWS billing engine. In reality, it will be chatting with a humble local container running MiniStack on your laptop. Terraform will behave exactly as it would against the real cloud, totally oblivious to our little conspiracy.

This guide covers two distinct crimes against cloud computing. First, we will point your actual Terraform configuration at MiniStack instead of a real AWS account. Second, we will use that same setup to run full integration tests on your machine in seconds.

Constructing the cardboard storefront

MiniStack acts as a drop-in endpoint override for Terraform. You do not need a special plugin, and you can skip the usual agonizing authentication dance involving temporary tokens and multi-factor prompts. You simply point the AWS provider at your localhost port 4566, hand it some aggressively fake credentials, and let it do its job.

The most explicit way to pull off this trick is by adding an endpoints block to your provider configuration. This acts like a fake storefront, redirecting Terraform’s serious API calls into our local container.

provider "aws" {
  region                      = "eu-central-1"
  access_key                  = "fake_access_key"
  secret_key                  = "fake_secret_key"
  s3_use_path_style           = true
  skip_credentials_validation = true
  skip_metadata_api_check     = true
  skip_requesting_account_id  = true
endpoints {
    s3       = "http://localhost:4566"
    dynamodb = "http://localhost:4566"
    sqs      = "http://localhost:4566"
    lambda   = "http://localhost:4566"
    iam      = "http://localhost:4566"
  }
}

I prefer starting with this explicit block because it is completely transparent. You can see exactly which services are being hijacked and sent to your local machine. If you only list the specific services you are actually using, this block conveniently doubles as a tidy inventory of your stack.

If you prefer to avoid maintaining this list by hand, a handy Python wrapper called tflocal will generate it for you automatically. You just install it via pip and run tflocal apply instead of your usual Terraform commands. It behaves identically, making it an easy substitute in any workflow.

Hiding the heavy machinery in the basement

It is incredibly tempting to spin up a Lambda function, a message queue, and a database using a dozen individual command-line instructions. That is fine for a quick afternoon experiment, but it is a terrible way to manage real software.

A production environment requires these resources to be properly defined in Terraform. I will spare you the visual trauma of scrolling through a massive hundred-line configuration file. I have placed the entire, glorious, fully functional Terraform manifest in a GitHub repository for those who enjoy copying and pasting wholesale infrastructure.

For the sake of our sanity here, let us just look at a tiny slice of the pie. We want to provision a DynamoDB table for tracking lost laundry items and a Lambda function to process them. Here is how standard and boring the configuration looks, completely devoid of any local-testing hacks.

resource "aws_dynamodb_table" "lost_laundry" {
  name         = "lost_socks_inventory"
  billing_mode = "PAY_PER_REQUEST"
  hash_key     = "sock_id"

  attribute {
    name = "sock_id"
    type = "S"
  }
}
resource "aws_lambda_function" "laundry_worker" {
  function_name = "sock_matcher"
  runtime       = "nodejs20.x"
  handler       = "index.handler"
  role          = aws_iam_role.dummy_lambda_role.arn
  filename      = "${path.module}/../sock_matcher_code.zip"
  
  environment {
    variables = {
      TABLE_NAME = aws_dynamodb_table.lost_laundry.name
    }
  }
}

When you run an apply command against this setup, it creates the resources locally. They are reproducible, they are safely version-controlled, and they are mathematically identical in shape to whatever you will eventually deploy to a real data center.

Poking the mirage with actual code

Here is where this bizarre local loop graduates from a neat party trick to a genuinely powerful tool. You can spin up MiniStack, apply your Terraform configuration, run real integration tests against the provisioned resources, and tear it all down.

Instead of clicking through a web console and waiting for a database to spawn while your coffee slowly turns into iced coffee, everything happens locally. A minimal Jest integration test hitting our fake infrastructure looks exactly like a real one.

const { SQSClient, SendMessageCommand } = require('@aws-sdk/client-sqs');
const { DynamoDBClient, GetItemCommand } = require('@aws-sdk/client-dynamodb');

const localConfig = {
  endpoint: 'http://localhost:4566',
  region: 'eu-central-1',
  credentials: { accessKeyId: 'fake', secretAccessKey: 'fake' },
};

const sqs = new SQSClient(localConfig);
const dynamo = new DynamoDBClient(localConfig);

test('worker processes a lost sock notification into the database', async () => {
  await sqs.send(new SendMessageCommand({
    QueueUrl: 'http://localhost:4566/000000000000/laundry_queue',
    MessageBody: JSON.stringify({ sock_id: 'argyle-001', status: 'missing' }),
  }));

  // Wait a brief moment for the event mapping to trigger our Lambda
  await new Promise((resolve) => setTimeout(resolve, 2000));

  const result = await dynamo.send(new GetItemCommand({
    TableName: 'lost_socks_inventory',
    Key: { sock_id: { S: 'argyle-001' } },
  }));

  expect(result.Item).toBeDefined();
  expect(result.Item.status.S).toEqual('missing');
});

This is the beautiful part. This test is not hitting a polite JavaScript mock or a hardcoded stub. It is sending a real message payload through a real routing queue, triggering an actual local Lambda invocation, and reading the resulting data back out of a local DynamoDB instance. It does all of this in the fraction of a second it takes a normal test suite to run.

The automated sandcastle stomping machine

Running this locally is great for your own mental health, but wiring it into Continuous Integration is where the real magic happens. Every single pull request can now provision a full copy of your infrastructure, run tests against it, and destroy it.

Building this up just to immediately tear it down is the digital equivalent of constructing an architecturally flawless sandcastle and then joyfully stomping on it.

jobs:
  phantom-integration-tests:
    runs-on: ubuntu-latest
    services:
      ministack:
        image: ministackorg/ministack:latest
        ports:
          - 4566:4566
    steps:
      - name: Checkout the laundry code
        uses: actions/checkout@v4

      - name: Install Terraform
        uses: hashicorp/setup-terraform@v3

      - name: Build the fake infrastructure
        run: |
          cd infrastructure
          terraform init
          terraform apply -auto-approve

      - name: Run the integration suite
        run: npm run test:integration

No AWS account is ever touched. No unexpected bills arrive at the end of the month. No developer sits around waiting five minutes for a queue to provision just to find out they made a typo in a variable name.

Incompetent security guards and other minor tragedies

There are a few sharp edges to this workflow that you should know about before you fully commit to the illusion.

First, we need to talk about Terraform state handling. You must decide up front whether your local Terraform state should persist between runs or reset every time. For CI environments, you absolutely want a blank canvas. Both the Terraform state and the MiniStack container state should be annihilated on every run. Do not try to recycle a local terraform.tfstate file across automated runs.

Second, we need to address the elephant in the room regarding permissions. MiniStack is wonderful, but when it comes to Identity and Access Management, it acts like a nightclub bouncer who is asleep on a barstool. MiniStack will happily let Terraform create a role with entirely incorrect permissions. Your Lambda could be given a policy that only allows it to read from an S3 bucket, but MiniStack will still let it write to DynamoDB.

Your integration tests will pass with flying colors because MiniStack simply does not enforce IAM boundaries strictly. A green test suite in this local setup confirms that your application logic works flawlessly. It absolutely does not confirm that your IAM policies are correct. You still need a real cloud environment, or a dedicated policy linter, to prevent a permissions disaster in production.

Finally, beware of provider version drift. MiniStack tracks the AWS API closely, but if you upgrade to the absolute newest Terraform provider the day it is released, there might be a short lag before new resource attributes are supported locally. If an apply command suddenly fails with an unrecognized attribute error, check your provider versions before you start questioning your own sanity.

We have reached a point where the local development loop is actually pleasant. We can define our infrastructure, apply it against a local container, run real integration tests against local services, and tear it all down on every single code change. We get all the confidence of testing against the cloud with none of the waiting, and more importantly, none of the invoices.

The mysterious disappearance of your Bash variables

You stare at the screen. A clunky while loop sits there, tasked with processing exactly one single line of text. It looks like a grown adult wearing inflatable arm floaties in a puddle. It is offensive to your sensibilities as a clean, efficient programmer.

Here is the offending legacy code, minding its own business:

echo "Sector_7G" | while read -r zone; do
    echo "Deploying update to $zone"
done

There is only one line of input coming from that echo command. Wrapping a while loop around a single item is administrative overkill. You decide to fire the useless middle management. Why keep a loop when you can simply pipe the value directly into the read command and print it out on the next line?

You swiftly refactor the code into a sleek, modern masterpiece of brevity:

echo "Sector_7G" | read -r zone
echo "Deploying update to $zone"

The two versions look like they should produce the exact same result. They do not.

The first version successfully prints your deployment message. The second version, your beautifully optimized creation, prints a depressing half-sentence: Deploying update to.

At first, this makes absolutely no sense. The read command clearly received the input. The script did not freeze and wait for you to type something on the keyboard, which means the text from the echo command was successfully swallowed by read. The problem is what Bash decided to do with your variable immediately afterward.

A bureaucratic murder mystery

To understand where your variable went, you have to understand how the pipe operator actually functions. The vertical bar | is not a simple plumbing tube that gently moves water from one place to another. In the world of Bash, a pipeline is a paranoid corporate temp agency.

In Bash, every command in a pipeline is executed in its own isolated environment, known as a subshell.

When you type echo “Sector_7G” | read -r zone, Bash refuses to let your main script handle the incoming data directly. Instead, it hires two temporary workers. One temp worker is hired solely to shout the word “Sector_7G“. The second temp worker, confined to a tiny, soundproof cubicle called a subshell, is hired to execute the read command.

The read command does exactly what you asked. It wakes up in its temporary cubicle, catches the text coming through the pipe, proudly writes it on a sticky note labeled $zone, and slaps it on the desk. The temp worker is happy. They have successfully assigned the variable.

But the exact millisecond the pipeline finishes executing, Bash acts as a ruthless corporate liquidator. It fires the temp worker, incinerates the cubicle, and shreds every single sticky note inside it.

When the script moves to the next line of your code to print the message, it is running in the parent shell. This is the executive boardroom. The parent shell has absolutely no idea what happened down in the temporary cubicles. To the parent shell, the variable $zone is completely empty because the employee holding it no longer exists.

This explains why your original, clunky while loop actually worked. The echo statement was trapped inside the loop, meaning it was executed inside the exact same temporary cubicle as the read command.

Taking hostages in the cubicle

Now that we know the pipe operator is essentially an incinerator for local variables, how do we fix the optimization without reverting to a pointless while loop? You have a few clever options for tricking the bureaucracy.

If you absolutely must keep the pipeline, you can use curly braces to group your commands together. This forces both the data reading and the subsequent actions to execute inside the same doomed environment.

echo "Sector_7G" | { read -r zone; echo "Deploying update to $zone"; }

This is basically a hostage situation. You know the temporary office is going to be burned to the ground in a fraction of a second, so you force the worker to finish the entire presentation and broadcast the results before the corporate security guards arrive. The variable is still trapped in a subshell, but since you are utilizing it from within that same confined space, it works perfectly.

Bypassing the mailroom entirely

If you want a cleaner script, you should avoid the temp agency altogether. Process substitution is the modern, preferred way to handle this problem.

Instead of piping data forward into a read command, you redirect the output of a command block directly into the input stream of your main shell. It looks like a slightly confused bird beak, but it is highly effective.

read -r zone < <(echo "Sector_7G")
echo "Deploying update to $zone"

There is no pipeline here. You have completely bypassed the subshell creation protocol. It is the equivalent of installing a pneumatic tube that shoots the document directly onto your executive desk. The read command executes in your primary, current shell, which means your shiny new variable is saved exactly where you need it, safe from incineration.

The lazy desk slap method

Sometimes you do not need a pneumatic tube. If you are just passing a simple string of text or the evaluated result of a basic command, you can use a here-string. This is denoted by three consecutive less-than signs.

read -r zone <<< "Sector_7G"

Like process substitution, this completely avoids pipelines and subshells. It is the administrative equivalent of walking into the office and slapping the raw data directly onto the read command’s desk without filling out any requisition forms. It is fast, slightly dirty, and entirely immune to the subshell vanishing act.

The dark magic corporate loophole

Perhaps you are a Bash purist. You insist on using standard vertical pipes, you refuse to use curly braces, and you demand that your variables survive the process. If you are running Bash version 4.2 or newer, there is a bureaucratic loophole you can exploit.

You can flip a magic switch at the absolute top of your script.

shopt -s lastpipe
echo "Sector_7G" | read -r zone
echo "Deploying update to $zone"

The lastpipe option is a buried corporate policy that tells Bash to change how it handles the assembly line. It mandates that the very last command in any pipeline gets a full-time contract. Instead of spawning a doomed subshell for the final command, Bash executes it in the current, parent shell environment.

A word of warning for those who like to test things live. This magical loophole works beautifully inside saved scripts, but if you try typing it directly into your interactive terminal, Bash will likely ignore you. The terminal environment uses job control, which interferes with this policy. It is strictly a trick for your automated scripts.

The final autopsy report

Bash pipelines are undeniably brilliant mechanisms for shuffling text from one department to another. They are the efficient conveyor belts of the command line. However, we must stop viewing them as simple plumbing. A pipeline is actually a high-security quarantine zone managed by a deeply paranoid human resources department. It operates on a strict policy of total deniability. The exact millisecond the data transfer is complete, the entire department is liquidated with extreme prejudice.

The next time a vital piece of data vanishes without a ransom note after being perfectly processed, resist the urge to question your own sanity. Do not assume you typed the variable name incorrectly. Instead, look closely at your syntax. Look for that single, innocent-looking vertical bar.

The pipe symbol looks like a harmless structural pillar holding your commands together. In reality, it is a locked door behind which your local variables are quietly smothered with a bureaucratic pillow. Your data was not misplaced due to bad code. It was simply assigned to a temporary employee who was instantly fired, erased from the corporate registry, and escorted off the premises before they could hand you the final report. Welcome to Bash administration. The bureaucracy always wins, but at least now you know how to forge the paperwork.

Poking dead servers with a long stick

Let us discuss the biological absurdity of the modern distributed system. You took a perfectly healthy, monolithic software organism and chopped it into a thousand fleshy little pieces, hoping they would communicate flawlessly via telepathy. Congratulations on your trendy new microservice architecture. You have not eliminated failure. You have merely sprayed it across a much wider geographic area, much like a sneeze in a crowded elevator. Now, instead of one predictable, honest crash, you get the distinct thrill of watching a single sluggish database slowly asphyxiate an entire ecommerce empire.

Welcome to the domino effect of modern software anatomy.

The pathology of a fragile network

Networks are pathological liars. They will hand you a glossy brochure promising 99.99 percent absolute uptime, but they will gladly drop your data packets into a black void the moment a slightly distracted contractor named Gary clips a buried fiber optic cable with a backhoe in rural Nevada. The physical reality of the internet is just dirt, glass, and human error.

When Service A politely asks Service B for a user profile, and Service B decides to take a spontaneous, catatonic nap, Service A does not simply walk away. It stands there. It holds open a network connection, consumes a vital thread of server memory, and stares blankly into the middle distance.

If you multiply this behavior by ten thousand concurrent users, you trigger a physiological crisis known as thread pool exhaustion. Your servers are now experiencing the digital equivalent of full organ failure. They are holding their breath, turning blue, waiting for a response that will never, ever arrive. The entire system locks up, your CEO’s pager shrieks at three in the morning, and you are left in the unenviable position of explaining why a minor hiccup in a wildly unpopular newsletter signup widget successfully assassinated the global payment gateway.

Treating your infrastructure like a flaky friend

To survive this architectural nightmare, you must abandon the delusion that your servers are reliable professionals. You must treat them like that one unreliable acquaintance who constantly forgets their wallet at dinner and occasionally faints in public. You need to implement an intervention. You need a circuit breaker.

The humble timeout is your first line of defense. This is the fine art of setting a strict, unyielding timer on your own patience. If a downstream service does not respond in two hundred milliseconds, you violently sever the connection. It is exactly like walking away from a barista who has been staring unblinkingly at a single coffee bean for ten consecutive minutes while a line forms out the cafe door. A timeout ensures your system does not waste precious metabolic energy waiting for a lost cause.

Sometimes, of course, a failure is just a biological blip. A momentary digital hiccup. So, you retry the request. But here lies a fatal trap for the overly optimistic engineer. If five thousand instances of your application instantly retry a failing API at the same millisecond, you have not built a resilient system. You have built a self-inflicted stampede.

You must use exponential backoff, which means waiting longer between each frantic attempt, combined with jitter, which adds a sprinkle of mathematical randomness to the wait time. Instead of your requests acting like a synchronized mob of impatient shoppers trying to smash through the glass doors of a mall on Black Friday, they behave like a group of mildly awkward guests politely knocking on a bathroom door at totally irregular intervals.

The anatomy of an electrical intervention

Circuit breakers have three distinct physiological states, and they operate much like a stressed human nervous system. We begin with the closed state. In electrical terms, closed means the current is flowing beautifully. The system silently monitors the background failures, much like your immune system quietly disposes of mutant cells without bothering your conscious brain. As long as the error rate stays below a defined threshold, the circuit remains closed. Ignorance, in this highly specific context, is pure bliss.

But once the failures cross your designated threshold, say, fifty percent of requests vanish into the ether within ten seconds, the circuit violently opens. The breaker trips. All subsequent calls to the failing service are instantly blocked. No waiting, no polite timeouts, just an immediate and hard refusal.

Think of the open state as a digital restraining order. You are giving the overwhelmed, hyperventilating downstream service a chance to breathe, reboot, or extinguish whichever physical server rack is currently melting into a puddle of expensive plastic. You amputate the limb to save the patient.

Eventually, you need to know if the fire is out. After a mandatory cooldown period, the breaker enters the half-open state. It cautiously lets one or two requests slip through the barricade to test the waters. This is the architectural equivalent of poking a corpse with a very long stick to see if it twitches. If those brave scout requests succeed, the system assumes a resurrection has occurred, the circuit closes, and normal traffic resumes. If they fail, the breaker snaps open again, and the waiting period restarts from scratch.

Handing out cardboard boxes to angry toddlers

When the circuit is aggressively open, you need a backup plan. You cannot just leave your users staring at a blank screen. This concept is called graceful degradation.

If your ultra-personalized, wildly expensive artificial intelligence recommendation engine falls unconscious, you do not throw a catastrophic internal server error at your customer. You return a static, heavily cached list of generic top-selling items. It is the exact equivalent of handing a toddler an empty cardboard box because their expensive remote control car just shattered into pieces against a wall. They will not love the box quite as much, but it distracts them, it provides a fleeting moment of joy, and most importantly, it stops the screaming.

How to avoid going to jail over a toaster

We must read the fine print before you run off to implement this on your production servers. Do not casually throw retries at every single problem you encounter.

Retrying a read request, like fetching a user profile picture, is perfectly safe. Retrying a write request that is not idempotent, like charging a credit card, is exactly how you end up the star defendant in a messy class action lawsuit. If your timeout triggered merely milliseconds after the payment processor actually received the initial request, hitting retry means the customer just bought that premium stainless steel toaster twice. Or perhaps three times, depending on how aggressively your system panicked. Your users will not be amused when a pallet of kitchen appliances arrives at their front door.

Furthermore, you must beware of nested timeouts. If your primary API gateway has a timeout of two seconds, but the underlying microservice deep in the server basement has a timeout of five seconds, the gateway will hang up the phone on the client long before the job is done. Meanwhile, the microservice is still cheerfully crunching data in the dark, entirely unaware that the customer has already left.

It is a spectacular waste of compute power. It is akin to a Michelin star chef meticulously garnishing a five-course meal for a restaurant guest who already climbed out the bathroom window and is currently sprinting down the highway.

Ultimately, building resilient systems is not about preventing failure. Believing you can prevent failure is a delusion reserved for people who do not work with computers. Failure is a mathematical certainty, an inevitable decay akin to biological aging. True engineering is about orchestrating that failure so elegantly, so quietly, that nobody notices the kitchen is currently engulfed in flames. You design for disaster, you code for catastrophe, and then, miraculously, you might just get to sleep through the night without your pager screaming at you about a dead database.

Stop using RSA just because it looks appropriately heavy

A few years ago, a colleague sent me an SSH public key so I could grant them access to one of our servers. I opened the file, looked at it, and immediately frowned.

It looked like this:

ssh-ed25519 AAAAC3NzaC1lZDI1NTE5AAAAIAAAAAwA...

It was tiny. It looked like a typo. It looked like something a cat would produce by walking across a keyboard on its way to the food bowl.

I had spent my entire professional life dealing with RSA keys. RSA keys are the cryptographic equivalent of a 1970s Buick. They are massive. They take up three parking spaces in your terminal window. They practically come with their own zip code:

ssh-rsa AAAAB3NzaC1yc2EAAAADAQABAAABAQ... [insert three paragraphs of gibberish here]

My first reaction was simple, visceral, and completely wrong: This can’t be secure. It’s too small.

I assumed my colleague had made a mistake. Perhaps they had prematurely hit ‘Enter’, or their copy-paste buffer had suffered a catastrophic failure. So, with the gentle, patronizing tone of a seasoned sysadmin, I emailed them back and asked for a “proper” key. You know, an adult key. A key with some girth to it.

After a bit of light reading, and a healthy dose of public humiliation, I realized I was the idiot in this transaction. That short little string wasn’t broken. It was an ED25519 key. And as it turns out, it is superior to my beloved, lumbering RSA keys in almost every conceivable way.

Here is why you need to stop size shaming modern SSH keys, and why ED25519 is the tiny, aggressive honey badger of cryptography.

1. The agony of matchmaking vs. the beauty of chaos

To understand why ED25519 is better, you have to look at how these keys are born.

Creating an RSA key is like playing an exhausting game of mathematical matchmaking. The algorithm requires you to find two massive, entirely random prime numbers, and then multiply them together. The security of RSA relies on the fact that while multiplying two giant primes is easy for a computer, figuring out which two primes were multiplied together (factoring) is incredibly hard.

But there’s a catch. Finding those primes is tedious. The code required to generate and verify them is complex. And if your random number generator is even slightly flawed, or if the code is compromised, which has famously happened before, you end up with a weak, easily crackable key. RSA is picky. It demands very specific, artisanal, farm-to-table numbers.

ED25519, on the other hand, is gloriously unpretentious.

It is based on Elliptic Curve Cryptography (specifically, Twisted Edwards curves, which sounds less like math and more like a Victorian stomach ailment). Because of how elliptic curves work, ED25519 doesn’t need two massive primes. It just needs a random number. Any random number. Give it 32 bytes of pure, unadulterated digital chaos, and it says, “Perfect, I can work with this.” It’s simpler, less prone to implementation errors, and incredibly resilient.

2. It packs a bigger punch in a smaller package

Despite being roughly a sixth of the size of a standard 4096-bit RSA key, an ED25519 key provides an equivalent, if not higher, level of security.

In cryptography, bigger isn’t inherently better; it just means the math you’re relying on is less efficient. RSA is a relic of an era relying on integer factorization. ED25519 relies on the discrete logarithm problem for elliptic curves. I won’t bore you with the math, mostly because I don’t want to explain it, but the practical result is that an attacker would need vastly more computing power to crack an ED25519 key than an RSA key of equivalent security level.

3. It’s fast. Disgustingly fast.

Because RSA keys are so massive, they take a measurable amount of time to generate. You run ssh-keygen -t rsa -b 4096, and you have enough time to take a sip of coffee while the computer sweats through the prime hunting process.

ED25519 keys generate almost instantaneously. More importantly, they are incredibly fast at the two things that actually matter day-to-day. Signing and verifying. When you log into a server, the authentication handshake happens faster, reducing CPU load. It also has the added benefit of being immune to certain side-channel attacks, where hackers monitor how long it takes your CPU to process a password to guess what it is. ED25519 operations run in “constant time,” meaning it gives attackers absolutely nothing to work with.

Embrace the tiny key

It took a bruised ego for me to let go of my RSA comfort blanket. But technology moves on. We no longer use vacuum tubes, we no longer print out MapQuest directions, and we no longer need our SSH keys to look like the terms and conditions of an iTunes update.

If you are still generating RSA keys, do yourself (and your servers) a favor. Type ssh-keygen -t ed25519. Embrace the tiny key. It won’t let you down.

Moving your SSH port actually makes your server less secure

Changing the default SSH port is one of those pieces of sysadmins advice that keeps getting repeated because it sounds sensible. Port 22 is well known, automated scanners constantly probe it, and moving SSH to something like 2222 makes the server appear a little less obvious.

It also gives you a new port number to remember. That trade-off would be worth discussing if changing the port provided meaningful protection. In most ordinary server setups, it does not. It mostly reduces some automated noise while adding a small amount of friction to your own workflow.

Suppose you move SSH from 22 to 2222. Your connection changes from:

ssh user@server

to:

ssh -p 2222 user@server

You can, of course, put the port in ~/.ssh/config:

Host foo.bar
    HostName foo.bar
    User user
    IdentityFile ~/.ssh/lorenba
    Port 2222

Now everything works exactly as before, but notice what happened? You changed a perfectly standard configuration, updated your client configuration to compensate for the change, and the bots still have a way to discover the SSH service.

The only obvious benefit is that some scanners looking specifically for port 22 will move on. Is that really worth optimizing?

The illusion of invisibility

Security through obscurity is a bit like hiding your house key under the doormat. It feels clever for about five seconds, right up until you realize that checking under the doormat is the very first thing a burglar will do. Modern port scanners do not just knock on port 22 and call it a day. A tool like Nmap can sweep all 65,535 ports on a machine in the time it takes you to take a sip of coffee. Once the scanner finds an open port, it probes the service. When your server enthusiastically responds with an SSH banner, the gig is up.

You have not hidden the service. You have only slightly delayed its inevitable discovery.

The privileged port problem

There is a more technical quirk to consider, one that often escapes casual observation. In Unix-like operating systems, ports below 1024 are considered “privileged ports.” Only the root user can bind to them. Port 22 falls safely inside this VIP section.

If you move your SSH daemon to a high port, say 2222 or 65000, you are stepping out of the privileged zone. Suppose a malicious actor manages to crash your SSH service, perhaps through an out-of-memory error or a kernel bug. If they have a non-root foothold on your system, they could potentially spin up their own rogue SSH daemon on that high port before your system restarts the legitimate one. Suddenly, you are authenticating against an attacker’s honeypot.

By keeping SSH on port 22, you guarantee that only a process with root privileges can handle your login requests. It is a subtle but foundational layer of trust.

What to do instead of moving the port

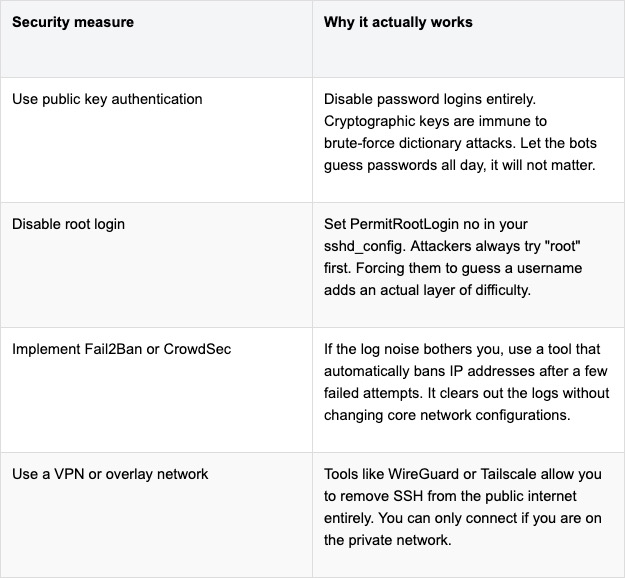
If changing the port is a theatrical distraction, how do we actually secure the server? The good news is that the alternatives are far more robust and require zero memorization of arbitrary numbers.

At the end of the day, port 22 is where SSH lives. Leaving it there is not a sign of laziness. It is a sign that you trust your actual security configurations rather than relying on a game of hide and seek.

Securing Hermes Agent without losing your mind in the process

I spent an evening reading the source of an AI agent that had been running on my own machine for three weeks, and I came away with two feelings that do not normally coexist. The first was relief, because the people at Nous Research clearly thought about this harder than I expected. The second was a mild, creeping unease, because the parts they could not protect are exactly the parts I had been ignoring.

Hermes Agent is an autonomous agent with persistent memory. It keeps state across sessions, works through long goals on its own schedule, writes its own reusable skills from experience, and talks to you from Telegram, Discord, or Slack while it does it. That last detail is the one that changes everything. A coding assistant sits politely in your IDE waiting to be asked. Hermes runs on a VPS you are not looking at, at three in the morning, and reports back later.

That is the feature. It is also the problem. So this is a guide to putting Hermes somewhere useful without handing it the keys to your production environment, written after actually reading what it already does for you, which turns out to be more than most blog posts on this subject assume.

Why an always-on agent is a different animal

The security model of a chatbot is simple because a chatbot has no initiative. It answers, it stops, it waits. Nothing happens between your messages.

An autonomous agent inverts that. Hermes monitors, decides, and acts without a human in the loop, which means three properties collapse together in a way that traditional threat modelling does not handle well.

It has initiative, so the trigger for an action may be a cron job or a Slack message from someone who is not you. It has memory, so a decision it makes today can influence a decision it makes next month, long after you have forgotten the context. And it has tools, so its output is not text; it is a shell command, an API call, a kubectl apply.

Combine those, and you get a category of failure that does not exist in ordinary software. An attacker does not need to compromise the agent’s process. They only need to get some text in front of it. A poisoned README in a repo it clones, a crafted issue on GitHub, a message in a channel it monitors. Prompt injection is not a memory safety bug you can patch. It is a consequence of the agent doing its job, which is reading things and acting on them.

What Hermes already gives you, which is not nothing

Here is the part that most security write-ups skip, and skipping it makes them both unfair and less useful. Hermes ships a documented defence-in-depth model with eight layers, and if you deploy it without knowing what they are, you will end up rebuilding controls that already exist while leaving the real gaps open.

The ones worth knowing before you write a single line of infrastructure:

Dangerous command approval. Before running a shell command, Hermes matches it against a list of destructive patterns (rm -r, mkfs, dd if=, DROP TABLE, curl … | sh, writes to /etc/ or ~/.ssh/). The default smart mode uses an auxiliary model to triage, trivially safe commands pass, clearly dangerous ones are denied, ambiguous ones escalate to you. Approval prompts fail closed after a timeout.

A hardline blocklist underneath all of it. A handful of unrecoverable commands (rm -rf /, fork bombs, zeroing a block device) are refused regardless of –yolo, regardless of “approvals.mode: off”, regardless of you clicking “allow always”. There is no override flag. This is a genuinely good design decision, and I wish more tools had it.

File write safety. write_file and patch are blocked from touching credential stores (~/.ssh/, ~/.aws/, ~/.kube/, .env files anywhere on disk) with no approval prompt and no way to override from chat.

SSRF protection on every URL-capable tool. Private ranges, loopback, link-local (including 169.254.169.254, the cloud metadata endpoint), and cloud metadata hostnames are blocked by default, with redirect chains revalidated at each hop.

Context file injection scanning. AGENTS.md, .cursorrules, and similar files are scanned for injection patterns, hidden HTML comments, and invisible Unicode before they reach the system prompt.

Gateway authorization that defaults to deny. If you configure no allowlists, nobody can talk to the bot.

Now, the important caveat, which the documentation itself states plainly. The write guards apply only to write_file and patch. The terminal tool runs as the same OS user and can cat or overwrite those same paths with a shell command. The approval system is a guardrail against an honest-but-mistaken agent. It is explicitly not a sandbox against a hostile one.

That distinction is the whole reason the rest of this article exists. Everything above stops the agent from making a mistake. Almost none of it stops an agent that has been successfully talked into something.

What “secure” should mean here

Before the configuration, the goals. An agent deployment is defensible when five things are true.

It has its own identity. The agent acts as itself, never as you. Every action is attributable to a principal that exists only for the agent and dies with it.

It runs least privilege by default-deny. It reaches exactly the systems its job requires, and the list of those systems is written down somewhere reviewable.

Its credentials are short-lived, narrow, and ideally invisible to it. The best secret is one the agent never holds.

Its runtime is contained. A compromised agent stays a compromised agent instead of becoming a compromised host.

Everything it does is reconstructable from immutable logs. Not from asking the agent what it remembers doing, which is roughly as reliable as asking a witness.

And a sixth one, specific to Hermes and to any agent with a learning loop, which I did not appreciate until I read the skills documentation: what the agent learns is code, and it must be treated as code. More on that in step seven, which is the step I would keep if I could only keep one.

Step 1: Contain the runtime

Never run the agent on the host, and never as root. Hermes makes this a one-line decision because the terminal backend is configurable, and switching it to Docker moves execution into a container that Hermes hardens itself:

# ~/.hermes/config.yaml

terminal:

  backend: docker

  docker_image: "nikolaik/python-nodejs:python3.11-nodejs20"

  docker_forward_env: []      # explicit allowlist only, empty keeps secrets out

  container_cpu: 1

  container_memory: 2048      # MB

  container_disk: 20480       # MB

  container_persistent: false # fresh filesystem per session

Every container Hermes launches gets –cap-drop ALL (with DAC_OVERRIDE, CHOWN and FOWNER added back so package managers work), –security-opt no-new-privileges, a 256 process limit, and size-limited tmpfs mounts on /tmp and /var/tmp with noexec on the latter. That is a better default than most hand-rolled docker run lines I have reviewed in production, including some of mine.

Two things to know about this switch.

First, “container_persistent: false” is the setting people skip. In persistent mode, the sandbox filesystem survives across sessions, which means an attacker who lands something in /workspace on Monday still has it on Thursday. Ephemeral mode throws it away. Use ephemeral unless you have a concrete reason not to.

Second, and this one surprised me. When the backend is a container, Hermes skips the dangerous command checks entirely, on the reasoning that the container is now the boundary. That reasoning is correct, and it also means your blast radius is now exactly the container definition. If you bind-mount your home directory in, you have quietly deleted both layers at once.

If you want a real boundary instead of a shared kernel, run this inside a microVM. Firecracker or Cloud Hypervisor boots in tens of milliseconds and gives you a hardware isolation line, which is a proportionate response to a workload whose behaviour you cannot fully predict.

If you use the official Docker image, note the operational trap. The gateway runs as the unprivileged hermes user (uid 10000), but “docker exec” defaults to root, and files that root creates are unreadable to the gateway. Pairing approvals fail silently.

docker exec -u hermes hermes-agent hermes pairing approve telegram ABC12DEF

Step 2: Control the egress

Data exfiltration is the worst outcome of a successful prompt injection, and it is the one where network controls beat application controls decisively. The agent can be talked into anything. The firewall cannot.

Start with the two settings Hermes already exposes:

# ~/.hermes/config.yaml

security:

  allow_private_urls: false     # default, keep it that way on any gateway

  website_blocklist:

    enabled: true

    domains:

      - "*.internal.company.com"

      - "admin.example.com"

  tirith_enabled: true

  tirith_fail_open: false       # block when the scanner is unavailable

  allow_lazy_installs: false    # no runtime pip installs

“tirith_fail_open: false” is the change worth arguing about. The default is true, meaning commands proceed if the content scanner is missing or times out. That is the right default for a laptop and the wrong one for a production gateway, where a scanner that is not running should stop the line rather than wave things through.

Then put a real allowlist under it, at the network layer, where the agent’s opinions do not matter. On Kubernetes:

apiVersion: networking.k8s.io/v1

kind: NetworkPolicy

metadata:

  name: hermes-agent-egress

  namespace: agents

spec:

  podSelector:

    matchLabels:

      app: hermes-agent

  policyTypes:

    - Egress

  egress:

    # DNS only to the cluster resolver

    - to:

        - namespaceSelector:

            matchLabels:

              kubernetes.io/metadata.name: kube-system

          podSelector:

            matchLabels:

              k8s-app: kube-dns

      ports:

        - protocol: UDP

          port: 53

    # everything else goes through the proxy, nowhere else

    - to:

        - podSelector:

            matchLabels:

              app: egress-proxy

      ports:

        - protocol: TCP

          port: 3128

Nothing else leaves. When the injection eventually happens, and it will, the exfiltration attempt dies at the network layer and lands in your proxy logs, which is the best possible outcome. An attack that failed and told you about itself.

Step 3: Give the agent its own identity

If the agent uses your kubeconfig, the agent is you. On a bad day, that means it holds cluster admin, and every command it hallucinates is permanently attributed to your name in the audit log. Explaining that in a post-incident review is a specific kind of misery.

Give it a ServiceAccount scoped to the handful of verbs it actually needs:

apiVersion: v1

kind: ServiceAccount

metadata:

  name: hermes-agent

  namespace: agents

---

apiVersion: rbac.authorization.k8s.io/v1

kind: Role

metadata:

  name: hermes-agent-reader

  namespace: apps

rules:

  - apiGroups: [""]

    resources: ["pods", "pods/log", "events", "services"]

    verbs: ["get", "list", "watch"]

  - apiGroups: ["apps"]

    resources: ["deployments", "replicasets"]

    verbs: ["get", "list", "watch"]

---

apiVersion: rbac.authorization.k8s.io/v1

kind: RoleBinding

metadata:

  name: hermes-agent-reader

  namespace: apps

subjects:

  - kind: ServiceAccount

    name: hermes-agent

    namespace: agents

roleRef:

  kind: Role

  name: hermes-agent-reader

  apiGroup: rbac.authorization.k8s.io

Read-only, namespaced, no wildcards. When the agent needs to restart a deployment, resist the urge to add patch on deployments and instead give it one narrow verb on one named resource, or better, a pipeline it can trigger that a human owns. Every verb you add here is a verb an attacker inherits.

Apply the same paranoia everywhere else it touches: a dedicated GitHub App with repository-scoped permissions instead of your PAT, a dedicated cloud service account instead of your admin role.

Step 4: Keep credentials short-lived, or absent

Long-lived static credentials are a bad idea in ordinary software. Handed to an agent that can be talked into printing them, they are a liability with an expiry date you do not control.

The first discipline is passthrough hygiene. Hermes strips sensitive variables from child processes by default: execute_code blocks anything whose name contains KEY, TOKEN, SECRET, PASSWORD, CREDENTIAL, or AUTH, and MCP subprocesses receive only PATH, HOME, USER, LANG, LC_ALL, TERM, SHELL, TMPDIR, and XDG_*. Everything else is stripped. Do not undo this. Every name you add to docker_forward_env or terminal.env_passthrough is a secret that code in the container can read and send anywhere.

The second is to stop giving it the secret at all. This is where I have to correct something I believed when I started writing: I assumed you would have to build the credential-injection proxy yourself as a sidecar. You do not. Hermes ships one.

hermes egress setup

The egress proxy (iron-proxy, a TLS-intercepting single binary managed by the Hermes egress commands) holds your real API keys on the host and gives the sandbox nothing but opaque tokens. The agent asks the proxy to make the call. The proxy injects the credential on the way out. The sandbox never sees a usable secret, so an injection that convinces the agent to exfiltrate its credentials exfiltrates a token that is worthless outside the proxy.

This is the single highest-value control in the entire article. It takes one command, and it is documented in a corner of the docs that almost nobody reads. If you take one thing from this piece, take this.

For cloud access, the same principle applies through Workload Identity or IRSA. The pod’s identity is federated at the API boundary, and there is no key material on disk to steal.

Step 5: Build an audit trail you can actually query

You need to answer who did what and when, from logs the agent cannot edit. Three sources, aggregated centrally:

The proxy access log, which is your ground truth for every outbound request, including the ones that were blocked.

The Kubernetes API server audit log, filtered to the agent’s identity so it is readable:

apiVersion: audit.k8s.io/v1

kind: Policy

rules:

  - level: RequestResponse

    users: ["system:serviceaccount:agents:hermes-agent"]

  - level: Metadata

    resources:

      - group: ""

        resources: ["secrets", "configmaps"]

And Hermes’ own state, which lives in ~/.hermes/logs/ and ~/.hermes/state.db. That database is genuinely useful, because it records which dangerous commands were classified and which ones actually executed. There is even a command that mines it:

hermes approvals suggest --days 90

It prints the patterns you approved most often. Read it as a confession rather than a convenience: if you have approved git push –force fourteen times, you have not been reviewing those prompts. You have been dismissing them. Ship ~/.hermes/ to your SIEM on a schedule, and remember that these logs live inside the blast radius, so they corroborate the external ones rather than replacing them.

Step 6: Cap the blast radius of always-on

Always-on means the exposure window never closes, so put ceilings on everything that can run away.

# ~/.hermes/config.yaml

approvals:

  mode: manual          # no auxiliary-model triage in production

  timeout: 120

  cron_mode: deny       # headless jobs never auto-approve

  single_query_mode: deny

  deny:

    - "git push --force*"

    - "kubectl delete*"

    - "terraform apply*"

    - "*curl*|*sh*"

Note what approvals.deny is for. It sits below –yolo and “approvals.mode: off”, so it survives the moment six months from now when somebody adds –yolo to a script to unblock a deploy. Write the list for that person, because that person is you on a Friday.

Set a hard spending cap on the provider API key at the provider. And keep the gateway allowlist explicit. Never “GATEWAY_ALLOW_ALL_USERS=true”:

# ~/.hermes/.env

TELEGRAM_ALLOWED_USERS=123456789

SLACK_ALLOWED_USERS=U01ABC123

chmod 600 ~/.hermes/.env

Step 7: Treat what the agent learns as untrusted code

This is the step that does not appear in generic agent hardening guides, because it is specific to agents that learn, and it is the one I would fight to keep.

Hermes’ defining feature is its learning loop. When it solves something, it writes a reusable skill as a Markdown file, stores the outcome in persistent memory, and adjusts next time. Agent-created skills land in ~/.hermes/skills/.

Sit with that for a second. The agent writes procedure documents that the agent later follows. Which means a prompt injection does not have to steal anything today. It can instead persuade the agent to write a skill, and that skill will be loaded and followed next week, next month, in a session that has nothing to do with the original attack, triggered by a cron job while you are asleep. Every control in steps one through six is scoped to a session. This one crosses sessions. It is persistence, in the red-team sense of the word, implemented as a feature.

Nous clearly thought about this. Skills installed from the Hub and skills carried by repositories are scanned for prompt injection directives, credential exfiltration commands, and hidden text tricks, and a skill that fails the scan is quarantined so it does not appear in the index and refuses to load by name. Repository skills require an explicit “hermes skills trust” before they load at all.

But a scanner is a filter, and filters have false negatives. For anything touching production, turn the gates on:

# ~/.hermes/config.yaml

skills:

  write_approval: true    # every skill create/edit/delete waits for you

memory:

  memory_enabled: true

  write_approval: true    # same gate on memory writes

With these on, writes are staged under ~/.hermes/pending/skills/ and you review them like a pull request:

/skills pending

/skills diff <id>

/skills approve <id>

/skills reject <id>

Then go one step further and make the skills directory a git repository:

cd ~/.hermes/skills && git init && git add -A

git commit -m "baseline: approved skill set"

Now every change the agent proposes to its own behaviour produces a diff with a timestamp and an author, reviewed by a human, revertable with one command. This costs you a few minutes a week and converts the most alarming property of the agent into the most auditable one.

One more thing on state. If you use the SSH, Modal, or Daytona backends, Hermes pushes ~/.hermes/ into the remote sandbox and syncs changed files back to the host afterwards, including skills the agent created remotely. The sandbox boundary you carefully built is, for this specific directory, a two-way street. Plan accordingly.

What is still broken after all seven steps

Two things, and I would rather say them than pretend the checklist is complete.

The terminal tool remains a hole in the write guards. Hermes’ protected-path denylist stops write_file and patch from touching ~/.ssh/ or .env files, but the terminal tool runs as the same OS user and can cat them with a shell command. The documentation says so explicitly. The only real answer is the container or microVM boundary from step one, which is why step one is step one.

Your guardrails now live in five different places. Kubernetes RBAC, cloud IAM, a NetworkPolicy, a proxy allowlist, and a YAML file in a home directory. There is no single pane of glass showing what the agent can do, and no way to ask “can it reach the payments database?” without checking five systems and reasoning about their intersection. Until unified agent control planes exist, the answer is Terraform: put all five in one repository, in one module, reviewed together, so that at least the drift is visible.

module "hermes_agent" {

  source = "./modules/agent-sandbox"

  agent_name          = "hermes-prod"

  k8s_namespace       = "agents"

  allowed_egress_fqdn = ["api.github.com", "hooks.slack.com"]

  iam_role_arn        = aws_iam_role.hermes_scoped.arn

  spend_cap_usd       = 200

}

The bottom line

Hermes Agent is a serious piece of engineering, and after a week of reading its source, I trust it more than I did going in, not less. It will automate the work you have been putting off, run deployments while you sleep, and behave, most of the time, like the relentless junior engineer you never managed to hire.

The thing to internalise is that its defaults are tuned for a developer laptop, which is the correct choice for the audience it has. Production is a different audience, and the gap between those two configurations is roughly the seven steps above. None of it is exotic. It is a container backend, a network policy, a service account, one command to set up the egress proxy, some log shipping, a deny list, and a git repository for the skills directory.

Give Hermes a well-lit room with a door you control, and it will change how you work. Give it your kubeconfig and an open egress path, and it will also change how you work, though the meeting where you explain it will be considerably less pleasant.

Why Base64 is not encryption and other hard truths about Kubernetes secrets

There is a widely accepted practice in modern cloud engineering that is roughly equivalent to writing your ATM pin on your forehead in Pig Latin and assuming you are safe from thieves. I am talking, of course, about the native Kubernetes secret.

If you crack open a standard Kubernetes secret manifest, you will see your database password transformed into a cryptic string of alphanumeric characters. It looks menacing. It feels secure. But it is just base64 encoding. Base64 is not encryption; it is an encoding scheme born in the late 1980s to help primitive mail servers safely transport text files without mangling them. Expecting Base64 to protect your production database credentials is like expecting a paper umbrella to protect you from a meteorite.

Yet, for years, the industry has coasted on this illusion of safety. Anyone with a terminal, broad RBAC permissions, and a passing familiarity with the echo command can decode these secrets in seconds. But the vulnerability does not stop at the API server.

The environmental hazard of the operating system gossip

Let us talk about environment variables. Passing credentials to applications via environment variables has been the default move since the dawn of the twelve factor app. It feels clean. It feels portable. It is also an absolute forensic disaster.

The Linux operating system is a chronic oversharer. Every process has a virtual file sitting at “/proc/$PID/environ”. This file contains every environment variable the process started with, neatly laid out for anyone to see. If your application crashes and dumps its memory, your database password goes with it into the logs. If an APM tool traces a slow transaction, your API keys might hitch a ride into your centralized logging dashboard.

The core objective of modern infrastructure security is surprisingly simple to state and agonizingly difficult to achieve. We must keep credentials off disks, out of environment variables, and away from static storage entirely.

The holy trinity of cloud native credential hygiene

The gold standard for fixing this mess relies on three concepts. Workload Identity, dynamic short-lived secrets, and in-memory injection.

First, we have to stop giving applications permanent passwords. Instead, we use Workload Identity. Think of this as biometric security for your code. The application does not carry a fake ID that says “I am the billing service and here is my password.” Instead, the cloud provider and the Kubernetes cluster establish trust through OIDC (OpenID Connect) federation. The kernel is already playing bouncer; it knows exactly which pod is running which service account. The infrastructure simply looks at the pod and says, “I recognize you, here is a temporary token valid for exactly ten minutes.”

Second, we use dynamic secret generation. If an application truly needs a database password, a tool like HashiCorp Vault or OpenBao intercepts the request, creates a brand new database user with a random password on the fly, and hands it over. The operational headache of manual credential rotation disappears because the credentials expire before anyone even has time to steal them.

Finally, these short-lived tokens are held solely in process memory. There is no file written to disk. There is no environment variable logged. When the pod terminates, the memory evaporates, leaving zero residual traces. The perfect crime, reversed.

Dealing with applications that refuse to evolve

This all sounds wonderful until you meet the real world. The real world is full of legacy applications that stubbornly refuse to speak native cloud identity APIs. They are the digital equivalent of that one uncle who still insists on paying for everything with exact change. They want a file on a disk, or they will simply refuse to start.

When theory crashes into stubborn codebases, we rely on a hierarchy of pragmatic workarounds.

The most elegant trick is using a sidecar or an init container to stream dynamic secrets into a shared memory volume. You tell Kubernetes to mount an emptyDir volume, but you back it with RAM instead of disk storage. The application thinks it is reading a perfectly normal file from a hard drive. In reality, it is reading a holographic projection of a password that exists only in volatile memory. If the server loses power, the secret ceases to exist.

Another popular option is the Secrets Store CSI Driver. This mounts secrets directly from cloud provider key vaults into the pod as files, completely bypassing the native Kubernetes etcd storage. It keeps the files off the permanent cluster disks while maintaining the file semantics the legacy application demands.

And then we have the External Secrets Operator (ESO). ESO is incredibly popular for GitOps workflows because it synchronizes external secrets from a secure vault directly into native Kubernetes secrets. It is highly convenient, but it comes with a caveat. You are still dumping that data into etcd storage. It is better than committing raw secrets to your git repository, but it is functionally similar to locking your front door and leaving the spare key under a very obvious welcome mat.

The uncomfortable conversation with compliance teams

Eventually, you will have to explain your architecture to a security and compliance auditor. This usually triggers an existential debate about where data residency begins and who actually holds the root key.

Compliance teams love hardware security modules (HSMs). They love knowing there is a physical, tamper-proof box in a data center somewhere holding the master key. Moving to a cloud provider’s KMS (Key Management Service) means handing that root trust over to Amazon, Google, or Microsoft.

GitOps engines like ArgoCD force teams to define clear architectural boundaries here. You have to separate the declarative dream of your infrastructure (the code sitting in your repository) from the runtime reality of the cluster. Tools like SOPS allow you to encrypt secrets directly inside your GitOps repositories, moving the security boundary entirely to decryption time.

The path away from plain environment variables is steep, and it requires a fundamental shift in how we think about identity. But continuing to rely on base64 obfuscation and environment variables is no longer a viable strategy. It is time to stop hiding our keys under the mat and start building infrastructure that simply does not need them.

RabbitMQ is not dying, but NATS keeps appearing at the crime scene

For years, if two pieces of enterprise software needed to securely pass a note to each other without losing it in the hallway, they used RabbitMQ. It was the unquestioned postal service of the backend infrastructure. You set it up, you fed it a steady diet of messages, and it delivered them with the stolid reliability of a 1950s government mail carrier.

There is always something inherently funny about serious engineers trusting their most critical financial transaction data to a piece of infrastructure named after a fluffy woodland creature, but the tech industry has never been one to shy away from absurd naming conventions.

RabbitMQ is mature, it is widely understood, and it solves the traditional message broker problem beautifully. The problem we are facing right now is not that RabbitMQ has somehow forgotten how to deliver the mail or died of old age. It has not been evicted due to incompetence. The issue is simply that the building it was designed to service has fundamentally changed its zoning laws.

Then someone changed the locks on the building

To understand what happened, we have to look at the architectural carnage of the last decade. We spent years systematically smashing massive monolithic applications into hundreds of tiny, independent microservices with a hammer. We are now acting mildly surprised that all those scattered pieces desperately need to talk to each other all the time.

The sheer volume of producers and consumers has multiplied in ways that a traditional, centralized broker finds exhausting to manage. Kubernetes normalized environments where pods pop in and out of existence like subatomic particles. Multi-region deployments became the standard rather than a luxury.

We no longer just want a highly reliable queue sitting safely between two predictable applications in a heavily air-conditioned server room. We want distributed systems talking across unpredictable networks. We are looking for something different. The industry is quietly moving away from heavy message brokers toward communication fabrics.

Why NATS suddenly fits the picture

If RabbitMQ is a heavy steel filing cabinet, NATS is a hyperactive but incredibly efficient bicycle courier. NATS started out with a very lightweight model based on subjects and publish-subscribe mechanics. It allowed for asynchronous communication and request-reply patterns with almost zero ceremonial overhead.

Initially, traditional enterprise architects looked at NATS, noticed it did not store messages permanently, and patted it on the head before going back to their heavy brokers. NATS was very fast, but it lacked a sense of object permanence.

Then came JetStream. JetStream bolted persistence, durable consumers, and message replay capabilities onto NATS. Suddenly, this lightweight tool could do the heavy lifting that previously required a dedicated traditional broker.

This is the exact point where NATS started showing up at the crime scene of modern architecture. Its operational simplicity and ridiculously small footprint fit perfectly into the Kubernetes ecosystem. NATS is not gaining all this attention simply because it is fast. It is gaining traction because its fundamental model looks exactly like the systems we are currently trying to build.

Artificial intelligence and the edge make things awkward

Things get genuinely weird when we step outside the traditional data center.

Edge computing requires communicating across distributed locations that are occasionally completely disconnected from the internet. The Internet of Things multiplies your endpoints into the millions, introducing a swarm of ephemeral connections. A smart tractor in a field in Iowa needs to send telemetry data to a regional server, and it does not care if your centralized message queue is currently feeling overwhelmed.

Modern artificial intelligence platforms make the situation even more chaotic. Agentic systems require constant events, transient workers, endless request-reply loops, and real-time coordination between wildly different components.

Heavy brokers start to sweat under these conditions. They were built for predictable plumbing, not for a chaotic web of intelligent agents and intermittent edge devices. NATS, however, was designed with lightweight, distributed topologies in mind from the very beginning. You can run a NATS server on a Raspberry Pi strapped to a weather balloon, or you can run it as a massive global supercluster. It does not really care. This architectural flexibility is exactly why modern workloads naturally gravitate toward it.

Architecture is not a high school popularity contest

Before the messaging purists start writing angry emails, we need to clarify something important. RabbitMQ is not the loser in this story.

RabbitMQ continues to evolve at a very healthy pace. The introduction of quorum queues and streams has modernized the platform considerably, bringing it up to speed with contemporary distributed consensus algorithms. It remains a genuinely excellent choice for many enterprise messaging workloads and traditional task queues.

If you have a RabbitMQ platform that is running smoothly and handling your current workload without complaints, migrating away from it just because NATS is currently trending on hacker forums would be a terrible technical decision.

We often treat software tools like sports teams, desperate to declare a definitive winner. But architecture is not a popularity contest. The relevant question is never which of the two products is objectively better. The only question that matters is which tool happens to fit the shape of your current problem.

The slightly uncomfortable question at the end

The reality of modern infrastructure forces us to be honest about our defaults.

If you were sitting down to design your messaging architecture today, with Kubernetes clusters, multiple geographic regions, edge workloads, and autonomous AI agents already sitting on your requirements list, would you still start with the exact same broker you blindly chose ten years ago?

RabbitMQ is not dying. NATS is not universally replacing it. What is fundamentally shifting is what we expect our messaging infrastructure to actually do for a living. NATS is proving particularly interesting right now because it arrived at the exact right moment with a model perfectly tailored to this architectural shift.

Technologies rarely disappear because they stop working. More often, the problem simply packs its bags and quietly moves somewhere else.