Docker used to be the answer you gave when someone asked, “How do we ship this thing?” Now it’s more often the answer to a different question, “How do I run this thing locally without turning my laptop into a science fair project?”
That shift is not a tragedy. It’s not even a breakup. It’s more like Docker moved out of the busy downtown apartment called “production” and into a cozy suburb called “developer experience”, where the lawns are tidy, the tools are friendly, and nobody panics if you restart everything three times before lunch.
This article is about what changed, why it changed, and why Docker is still very much worth knowing, even if your production clusters rarely whisper its name anymore.
What we mean when we say Docker
One reason this topic gets messy is that “Docker” is a single word used to describe several different things, and those things have very different jobs.
- Docker Desktop is the product that many developers actually interact with day to day, especially on macOS and Windows.
- Docker Engine and the Docker daemon are the background machinery that runs containers on a host.
- The Docker CLI and Dockerfile workflow are the human-friendly interface and the packaging format that people have built habits around.
When someone says “Docker is dying,” they usually mean “Docker Engine is no longer the default runtime in production platforms.” When someone says “Docker is everywhere,” they often mean “Docker Desktop and Dockerfile workflows are still the easiest way to get a containerized dev environment running quickly.”
Both statements can be true at the same time, which is annoying, because humans prefer their opinions to come in single-serving packages.
Docker’s rise and the good kind of magic
Docker didn’t become popular because it invented containers. Containers existed before Docker. Docker became popular because it made containers feel approachable.
It offered a developer experience that felt like a small miracle:
- You could build images with a straightforward command.
- You could run containers without a small dissertation on Linux namespaces.
- You could push to registries and share a runnable artifact.
- You could spin up multi-service environments with Docker Compose.
Docker took something that used to feel like “advanced systems programming” and turned it into “a thing you can demo on a Tuesday.”
If you were around for the era of XAMPP, WAMP, and “download this zip file, then pray,” Docker felt like a modern version of that, except it didn’t break as soon as you looked at it funny.
The plot twist in production
Here is the part where the story becomes less romantic.
Production infrastructure grew up.
Not emotionally, obviously. Infrastructure does not have feelings. It has outages. But it did mature in a very specific way: platforms started to standardize around container runtimes and interfaces that did not require Docker’s full bundled experience.
Docker was the friendly all-in-one kitchen appliance. Production systems wanted an industrial kitchen with separate appliances, separate controls, and fewer surprises.
Three forces accelerated the shift.
Licensing concerns changed the mood
Docker Desktop licensing changes made a lot of companies pause, not because engineers suddenly hated Docker, but because legal teams developed a new hobby.
The typical sequence went like this:
- Someone in finance asked, “How many Docker Desktop users do we have?”
- Someone in legal asked, “What exactly are we paying for?”
- Someone in infrastructure said, “We can probably do this with Podman or nerdctl.”
A tool can survive engineers complaining about it. Engineers complain about everything. The real danger is when procurement turns your favorite tool into a spreadsheet with a red cell.
The result was predictable: even developers who loved Docker started exploring alternatives, if only to reduce risk and friction.
The runtime world standardized without Docker
Modern container platforms increasingly rely on runtimes like containerd and interfaces like the Container Runtime Interface (CRI).
Kubernetes is a key example. Kubernetes removed the direct Docker integration path that many people depended on in earlier years, and the ecosystem moved toward CRI-native runtimes. The point was not to “ban Docker.” The point was to standardize around an interface designed specifically for orchestrators.
This is a subtle but important difference.
- Docker is a complete experience, build, run, network, UX, opinions included.
- Orchestrators prefer modular components, and they want to speak to a runtime through a stable interface.
The practical effect is what most teams feel today:
- In many Kubernetes environments, the runtime is containerd, not Docker Engine.
- Managed platforms such as ECS Fargate and other orchestrated services often run containers without involving Docker at all.
Docker, the daemon, became optional.
Security teams like control, and they do not like surprises
Security teams do not wake up in the morning and ask, “How can I ruin a developer’s day?” They wake up and ask, “How can I make sure the host does not become a piñata full of root access?”
Docker can be perfectly secure when used well. The problem is that it can also be spectacularly insecure when used casually.
Two recurring issues show up in real organizations:
- The Docker socket is powerful. Expose it carelessly, and you are effectively offering a fast lane to host-level control.
- The classic pattern of “just give developers sudo docker” can become a horror story with a polite ticket number.
Tools and workflows that separate concerns tend to make security people calmer.
- Build tools such as BuildKit and buildah isolate image creation.
- Rootless approaches, where feasible, reduce blast radius.
- Runtime components can be locked down and audited more granularly.
This is not about blaming Docker. It’s about organizations preferring a setup where the sharp knives are stored in a drawer, not taped to the ceiling.
What Docker is now
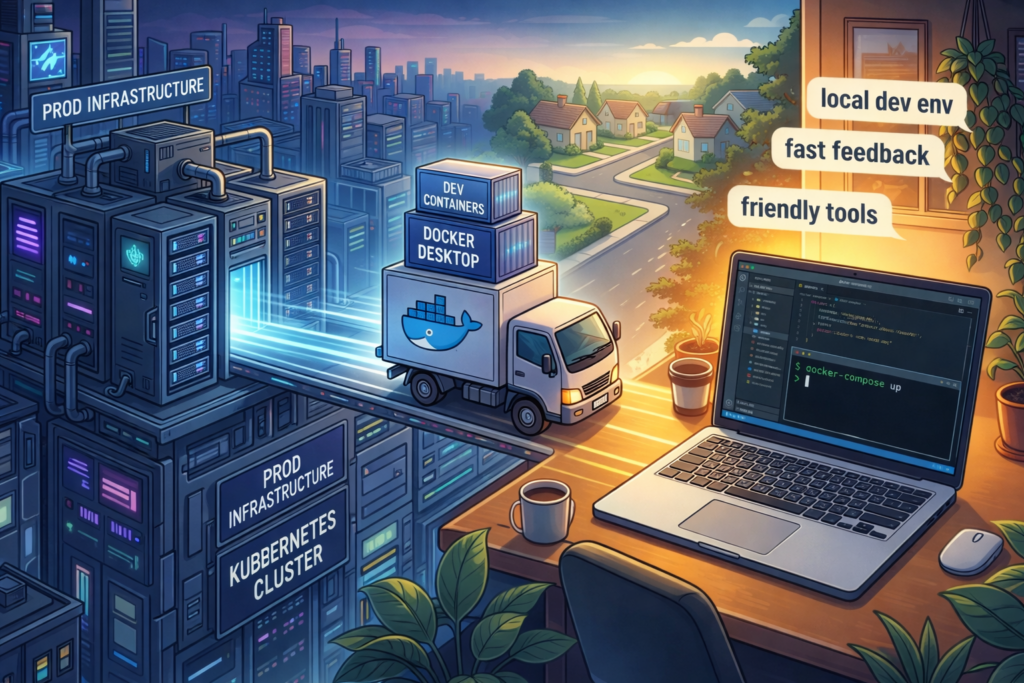
Docker’s new role is less “the thing that runs production” and more “the thing that makes local development less painful.”
And that role is huge.
Docker still shines in areas where convenience matters most:
- Local development environments
- Quick reproducible demos
- Multi-service stacks on a laptop
- Cross-platform consistency on macOS, Windows, and Linux
- Teams that need a simple standard for “how do I run this?”
If your job is to onboard new engineers quickly, Docker is still one of the best ways to avoid the dreaded onboarding ritual where a senior engineer says, “It works on my machine,” and the junior engineer quietly wonders if their machine has offended someone.
A small example that still earns its keep
Here is a minimal Docker Compose stack that demonstrates why Docker remains lovable for local development.
services:
  api:
    build: .
    ports:
      - "8080:8080"
    environment:
      DATABASE_URL: postgres://postgres:example@db:5432/app
    depends_on:
      - db

  db:
    image: postgres:16
    environment:
      POSTGRES_PASSWORD: example
      POSTGRES_DB: app
    ports:
      - "5432:5432"
This is not sophisticated. That is the point. It is the “plug it in and it works” power that made Docker famous.
Dockerfile is not the Docker daemon
This is where the confusion often peaks.
A Dockerfile is a packaging recipe. It is widely used. It remains a de facto standard, even when the runtime or build system is not Docker.
Many teams still write Dockerfiles, but build them using tooling that does not rely on the Docker daemon on the CI runner.
Here is a BuildKit example that builds and pushes an image without treating the Docker daemon as a requirement.
buildctl build \
  --frontend dockerfile.v0 \
  --local context=. \
  --local dockerfile=. \
  --output type=image,name=registry.example.com/app:latest,push=true
You can read this as “Dockerfile lives on, but Docker-as-a-daemon is no longer the main character.”
This separation matters because it changes how you design CI.
- You can build images in environments where running a privileged Docker daemon is undesirable.
- You can use builders that integrate better with Kubernetes or cloud-native pipelines.
- You can reduce the amount of host-level power you hand out just to produce an artifact.
What replaced Docker in production pipelines
When teams say they are moving away from Docker in production, they rarely mean “we stopped using containers.” They mean the tooling around building and running containers is shifting.
Common patterns include:
- containerd as the runtime in Kubernetes and other orchestrated environments
- BuildKit for efficient builds and caching
- kaniko for building images inside Kubernetes without a Docker daemon
- ko for building and publishing Go applications as images without a Dockerfile
- Buildpacks or Nixpacks for turning source code into runnable images using standardized build logic
- Dagger and similar tools for defining CI pipelines that treat builds as portable graphs of steps
You do not need to use all of these. You just need to understand the trend.
Production platforms want:
- Standard interfaces
- Smaller, auditable components
- Reduced privilege
- Reproducible builds
Docker can participate in that world, but it no longer owns the whole stage.
A Kubernetes-friendly image build example
If you want a concrete example of the “no Docker daemon” approach, kaniko is a popular choice in cluster-native pipelines.
apiVersion: batch/v1
kind: Job
metadata:
  name: build-image-kaniko
spec:
  template:
    spec:
      restartPolicy: Never
      containers:
        - name: kaniko
          image: gcr.io/kaniko-project/executor:latest
          args:
            - "--dockerfile=Dockerfile"
            - "--context=dir:///workspace"
            - "--destination=registry.example.com/app:latest"
          volumeMounts:
            - name: workspace
              mountPath: /workspace
      volumes:
        - name: workspace
          emptyDir: {}
This is intentionally simplified. In a real setup, you would bring your own workspace, your own auth mechanism, and your own caching strategy. But even in this small example, the idea is visible: build the image where it makes sense, without turning every CI runner into a tiny Docker host.
The practical takeaway for architects and platform teams
If you are designing platforms, the question is not “Should we ban Docker?” The question is “Where does Docker add value, and where does it create unnecessary coupling?”
A simple mental model helps.
- Developer laptops benefit from a friendly tool that makes local environments predictable.
- CI systems benefit from builder choices that reduce privilege and improve caching.
- Production runtimes benefit from standardized interfaces and minimal moving parts.
Docker tends to dominate the first category, participates in the second, and is increasingly optional in the third.
If your team still uses Docker Engine on production hosts, that is not automatically wrong. It might be perfectly fine. The important thing is that you are doing it intentionally, not because “that’s how we’ve always done it.”
Why this is actually a success story
There is a temptation in tech to treat every shift as a funeral.
But Docker moving toward local development is not a collapse. It is a sign that the ecosystem absorbed Docker’s best ideas and made them normal.
The standardization of OCI images, the popularity of Dockerfile workflows, and the expectations around reproducible environments, all of that is Docker’s legacy living in the walls.
Docker is still the tool you reach for when you want to:
- start fast
- teach someone new
- run a realistic stack on a laptop
- avoid spending your afternoon installing the same dependencies in three different ways
That is not “less important.” That is foundational.
If anything, Docker’s new role resembles a very specific kind of modern utility.
It is like Visual Studio Code.
Everyone uses it. Everyone argues about it. It is not what you deploy to production, but it is the thing that makes building and testing your work feel sane.
Docker didn’t die.
It just moved to your laptop, brought snacks, and quietly let production run the serious machinery without demanding to be invited to every meeting.