When ChatGPT emerged onto the tech scene in late 2022, it felt like someone had suddenly switched on the lights in a dimly lit room. Overnight, generative AI went from a niche technical curiosity to a global phenomenon. Behind the headlines and excitement, however, something deeper was shifting: cloud computing was experiencing its most significant transformation since its inception.
For nearly fifteen years, the cloud computing model was a story of steady, predictable evolution. At its core, the concept was revolutionary yet straightforward, much like switching from owning a private well to relying on public water utilities. Instead of investing heavily in physical servers, businesses could rent computing power, storage, and networking from providers like AWS, Google Cloud, or Azure. It democratized technology, empowering startups to scale into global giants without massive upfront costs. Services became faster, cheaper, and better, yet the fundamental model remained largely unchanged.
Then, almost overnight, AI changed everything. The game suddenly had new rules.
The hardware revolution beneath our feet
The first transformative shift occurred deep inside data centers, a hardware revolution triggered by AI.
Traditionally, cloud servers relied heavily on CPUs, versatile processors adept at handling diverse tasks one after another, much like a skilled chef expertly preparing dishes one by one. However AI workloads are fundamentally different; training AI models involves executing thousands of parallel computations simultaneously. CPUs simply weren’t built for such intense multitasking.
Enter GPUs, Graphics Processing Units. Originally designed for video games to render graphics rapidly, GPUs excel at handling many calculations simultaneously. Imagine a bustling pizzeria with a massive oven that can bake hundreds of pizzas all at once, compared to a traditional restaurant kitchen serving dishes individually. For AI tasks, GPUs can be up to 100 times faster than standard CPUs.
This demand for GPUs turned them into high-value commodities, transforming Nvidia into a household name and prompting tech companies to construct specialized “AI factories”, data centers built specifically to handle these intense AI workloads.
The financial impact businesses didn’t see coming
The second seismic shift is financial. Running AI workloads is extremely costly, often 20 to 100 times more expensive than traditional cloud computing tasks.
Several factors drive these costs. First, specialized GPU hardware is significantly pricier. Second, unlike traditional web applications that experience usage spikes, AI model training requires continuous, heavy computing power, often 24/7, for weeks or even months. Finally, massive datasets needed for AI are expensive to store and transfer.
This cost surge has created a new digital divide. Today, CEOs everywhere face urgent questions from their boards: “What is our AI strategy?” The pressure to adopt AI technologies is immense, yet high costs pose a significant barrier. This raises a crucial dilemma for businesses: What’s the cost of not adopting AI? The potential competitive disadvantage pushes companies into difficult financial trade-offs, making AI a high-stakes game for everyone involved.
From infrastructure to intelligent utility
Perhaps the most profound shift lies in what cloud providers actually offer their customers today.
Historically, cloud providers operated as infrastructure suppliers, selling raw computing resources, like giving people access to fully equipped professional kitchens. Businesses had to assemble these resources themselves to create useful services.
Now, providers are evolving into sellers of intelligence itself, “Intelligence as a Service.” Instead of just providing raw resources, cloud companies offer pre-built AI capabilities easily integrated into any application through simple APIs.
Think of this like transitioning from renting a professional kitchen to receiving ready-to-cook gourmet meal kits delivered straight to your door. You no longer need deep culinary skills, similarly, businesses no longer require PhDs in machine learning to integrate AI into their products. Today, with just a few lines of code, developers can effortlessly incorporate advanced features such as image recognition, natural language processing, or sophisticated chatbots into their applications.
This shift truly democratizes AI, empowering domain experts, people deeply familiar with specific business challenges, to harness AI’s power without becoming specialists in AI themselves. It unlocks the potential of the vast amounts of data companies have been collecting for years, finally allowing them to extract tangible value.
The Unbreakable Bond Between Cloud and AI
These three transformations, hardware, economics, and service offerings, have reinvented cloud computing entirely. In this new era, cloud computing and AI are inseparable, each fueling the other’s evolution.
Businesses must now develop unified strategies that integrate cloud and AI seamlessly. Here are key insights to guide that integration:
Integrate, don’t reinvent: Most businesses shouldn’t aim to create foundational AI models from scratch. Instead, the real value lies in effectively integrating powerful, existing AI models via APIs to address specific business needs.
Prioritize user experience: The ultimate goal of AI in business is to dramatically enhance user experiences. Whether through hyper-personalization, automating tedious tasks, or surfacing hidden insights, successful companies will use AI to transform the customer journey profoundly.
Cloud computing today is far more than just servers and storage, it’s becoming a global, distributed brain powering innovation. As businesses move forward, the combined force of cloud and AI isn’t just changing the landscape; it’s rewriting the very rules of competition and innovation.
The future isn’t something distant, it’s here right now, and it’s powered by AI.
Running many microservices feels a bit like managing a bustling shipping office. Packages fly in from every direction, each requiring proper labeling, tracking, and security checks. With every new service added, the complexity multiplies. This is precisely where a service mesh, like Istio, steps into the spotlight, aiming to bring order to the chaos. But as Kubernetes rapidly evolves, it’s worth questioning if Istio remains the best tool for the job.
Understanding the Service Mesh concept
Think of a service mesh as the traffic lights and street signs at city intersections, guiding vehicles efficiently and securely through busy roads. In Kubernetes, this translates into a network layer designed to manage communications between microservices. This functionality typically involves deploying lightweight proxies, most commonly Envoy, beside each service. These proxies handle communication intricacies, allowing developers to concentrate on core application logic. The primary responsibilities of a service mesh include:
Efficient traffic routing
Robust security enforcement
Enhanced observability into service interactions
The emergence of Istio
Istio was born out of the need to handle increasingly complex communications between microservices. Its ingenious solution includes the Envoy sidecar model. Imagine having a personal assistant for every employee who manages all incoming and outgoing interactions. Istio’s control plane centrally manages these Envoy proxies, simplifying policy enforcement, routing rules, and security protocols.
Growing capabilities of Kubernetes
Kubernetes itself continues to evolve, now offering potent built-in features:
NetworkPolicies for granular traffic management
Ingress controllers to manage external access
Kubernetes Gateway API for advanced traffic control
These developments mean Kubernetes alone now handles tasks previously reserved for service meshes, making some of Istio’s features less indispensable.
Areas where Istio remains strong
Despite Kubernetes’ progress, Istio continues to maintain clear advantages. If your organization requires stringent, fine-grained security, think of locking every internal door rather than just the main entrance, Istio is unrivaled. It excels at providing mutual TLS encryption (mTLS) across all services, sophisticated traffic routing, and detailed telemetry for extensive visibility into service behavior.
Weighing Istio’s costs
While powerful, Istio isn’t without drawbacks. It brings significant resource overhead that can strain smaller clusters. Additionally, Istio’s operational complexity can be daunting for smaller teams or those new to Kubernetes, necessitating considerable training and expertise.
Alternatives in the market
Istio now faces competition from simpler and lighter solutions like Linkerd and Kuma, as well as managed offerings such as Google’s GKE Mesh and AWS App Mesh. These alternatives reduce operational burdens, appealing especially to teams looking to avoid the complexities of self-managed mesh infrastructure.
A practical decision-making framework
When evaluating if Istio is suitable, consider these questions:
Does your team have the expertise and resources to handle operational complexity?
Are stringent security and compliance requirements essential for your organization?
Do your traffic patterns justify advanced management capabilities?
Will your infrastructure significantly benefit from advanced observability?
Is your current infrastructure already providing adequate visibility and control?
Just as deciding between public transportation and owning a personal car involves trade-offs around convenience, cost, and necessity, choosing between built-in Kubernetes features, simpler meshes, or Istio requires careful consideration of specific organizational needs and capabilities.
Real-world case studies
Startup Scenario: A smaller startup opted for Linkerd due to its simplicity and lighter footprint, finding Istio too resource-intensive for its growth stage.
Enterprise Example: A major financial firm heavily relied on Istio because of strict compliance and security demands, utilizing its fine-grained control and comprehensive telemetry extensively.
These cases underline the importance of aligning tool choices with organizational context and specific requirements.
When Istio makes sense today
Istio remains highly relevant in environments with rigorous security standards, comprehensive observability needs, and sophisticated traffic management demands. Particularly in regulated sectors such as finance or healthcare, Istio’s advanced capabilities in compliance and detailed monitoring are indispensable.
However, Istio is no longer the automatic go-to solution. Organizations must thoughtfully assess trade-offs, particularly the operational complexity and resource demands. Smaller organizations or those with straightforward requirements might find Kubernetes’ native capabilities sufficient or opt for simpler solutions like Linkerd.
Keep a close eye on the evolving service mesh landscape. Emerging innovations managed offerings, and continuous improvements to Kubernetes itself will inevitably reshape considerations around adopting Istio. Staying informed is crucial for making strategic, future-proof decisions for your cloud infrastructure.
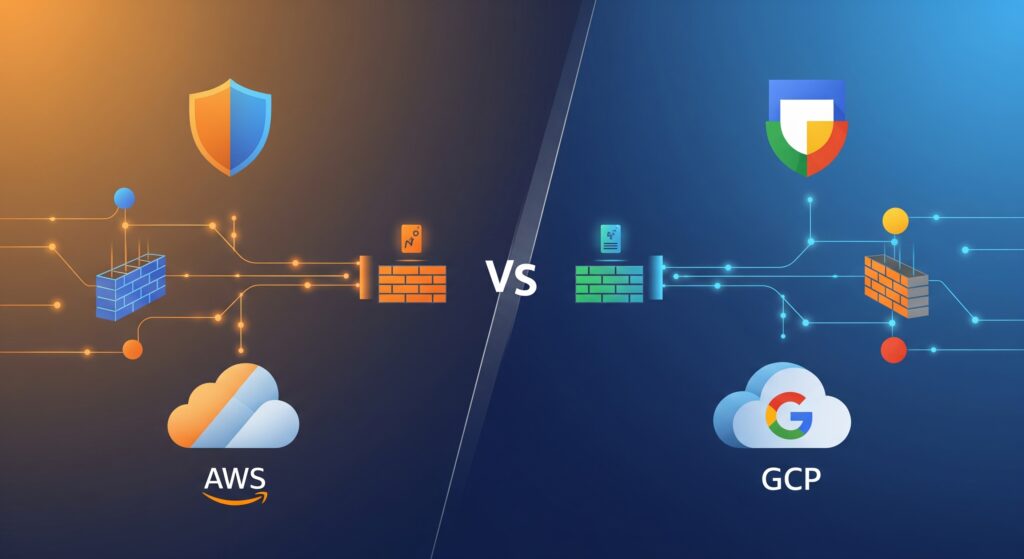
The digital world we’ve built in the cloud, brimming with applications and data, doesn’t just run on good intentions. It relies on robust, thoughtfully designed security. Protecting your workloads, whether a simple website or a sprawling enterprise system, isn’t just an add-on; it’s the bedrock. Both Amazon Web Services (AWS) and Google Cloud (GCP) are titans in this space, and both are deeply committed to security. Yet, when it comes to managing the flow of network traffic, who gets in, who gets out, they approach the task with distinct philosophies and toolsets. This guide explores these differences, aiming to offer a clearer path as you navigate their distinct approaches to network protection.
Let’s set the scene with a familiar concept: securing a bustling apartment complex. AWS, in this scenario, provides a two-tier security system. You have vigilant guards stationed at the main entrance to the entire neighborhood (these are your Network ACLs), checking everyone coming and going from the broader area. Then, each individual apartment building within that neighborhood has its own dedicated doorman (your Security Groups), working from a specific guest list for that building alone.
GCP, on the other hand, operates more like a highly efficient central security office for the entire complex. They manage a master digital key system that controls access to every single apartment door (your VPC Firewall Rules). If your name isn’t on the approved list for Apartment 3B, you simply don’t get in. And to ensure overall order, the building management (think Hierarchical Firewall Policies) can also lay down some general community guidelines that apply to everyone.
The AWS approach, two levels of security
Venturing into the AWS ecosystem, you’ll encounter its distinct, layered strategy for network defense.
Security Groups, your instances personal guardian
First up are Security Groups. These act as the personal guardian for your individual resources, like your EC2 virtual servers or your RDS databases, operating right at their virtual doorstep.
A key characteristic of these guardians is that they are stateful. What does this mean in everyday terms? Picture a friendly doorman. If he sees you (your application) leave your apartment to run an errand (make an outbound connection), he’ll recognize you when you return and let you straight back in (allow the inbound response) without needing to re-check your credentials. It’s this “memory” of the connection that defines statefulness.
By default, a new Security Group is cautious: it won’t allow any unsolicited inbound traffic, but it’s quite permissive about outbound connections. Crucially, this doorman only works with “allow” lists. You provide a list of who is permitted; you don’t give them a separate list of who to explicitly turn away.
Network ACLs, the subnets border patrol
The second layer in AWS is the Network Access Control List, or NACL. This acts as the border patrol for an entire subnet, a segment of your network. Any resource residing within that subnet is subject to the NACL’s rules.
Unlike the doorman-like Security Group, the NACL border patrol is stateless. This means they have no memory of past interactions. Every packet of data, whether entering or leaving the subnet, is inspected against the rule list as if it’s the first time it’s been seen. Consequently, you must create explicit rules for both inbound traffic and outbound traffic, including any return traffic for connections initiated from within. If you allow a request out, you must also explicitly allow the expected response back in.
NACLs give you the power to create both “allow” and “deny” rules, and these rules are processed in numerical order, the lowest numbered rule that matches the traffic gets applied. The default NACL that comes with your AWS virtual network is initially wide open, allowing all traffic in and out. Customizing this is a key security step.
GCPs unified firewall strategy
Shifting our focus to Google Cloud, we find a more consolidated approach to network security, primarily orchestrated through its VPC Firewall Rules.
Centralized command VPC Firewall Rules
GCP largely centralizes its network traffic control into what it calls VPC (Virtual Private Cloud) Firewall Rules. This is your main toolkit for defining who can talk to whom. These rules are defined at the level of your entire VPC network, but here’s the important part: they are enforced right at each individual Virtual Machine (VM) instance. It’s like the central security office sets the master rules, but each VM’s own “door” (its network interface) is responsible for upholding them. This provides granular control without the explicit two-tier system seen in AWS.
Another point to note is that GCP’s VPC networks are global resources. This means a single VPC can span multiple geographic regions, and your firewall rules can be designed with this global reach in mind, or they can be tailored to specific regions or zones.
Decoding GCPs rulebook
Let’s look at the characteristics of these VPC Firewall Rules:
Stateful by default: Much like the AWS Security Group’s friendly doorman, GCP’s firewall rules are inherently stateful for allowed connections. If you permit an outbound connection from one of your VMs, the system intelligently allows the return traffic for that specific conversation.
The power of allow and deny: Here’s a significant distinction. GCP’s primary firewall system allows you to create both “allow” rules and explicit “deny” rules. This means you can use the same mechanism to say “you’re welcome” and “you’re definitely not welcome,” a capability that in AWS often requires using the stateless NACLs for explicit denies.
Priority is paramount: Every firewall rule in GCP has a numerical priority (lower numbers signify higher precedence). When network traffic arrives, GCP evaluates rules in order of this priority. The first rule whose criteria match the traffic determines the action (allow or deny). Think of it as a clearly ordered VIP list for your network access.
Targeting with precision: You don’t have to apply rules to every VM. You can pinpoint their application to: .- All instances within your VPC network. .- Instances tagged with specific Network Tags (e.g., applying a “web-server” tag to a group of VMs and crafting rules just for them). .- Instances running with particular Service Accounts.
Hierarchical policies, governance from above
Beyond the VPC-level rules, GCP offers Hierarchical Firewall Policies. These allow you to set broader security mandates at the Organization or Folder level within your GCP resource hierarchy. These top-level rules then cascade down, influencing or enforcing security postures across multiple projects and VPCs. It’s akin to the overall building management or a homeowners association setting some fundamental security standards that everyone in the complex must adhere to, regardless of their individual apartment’s specific lock settings.
AWS and GCP, how their philosophies differ
So, when you stand back, what are the core philosophical divergences?
AWS presents a distinctly layered security model. You have Security Groups acting as stateful firewalls directly attached to your instances, and then you have Network ACLs as a stateless, broader brush at the subnet boundary. This separation allows for independent configuration of these two layers.
GCP, in contrast, leans towards a more unified and centralized model with its VPC Firewall Rules. These rules are stateful by default (like Security Groups) but also incorporate the ability to explicitly deny traffic (a characteristic of NACLs). The enforcement is at the instance level, providing that fine granularity, but the rule definition and management feel more consolidated. The Hierarchical Policies then add a layer of overarching governance.
Essentially, GCP’s VPC Firewall Rules aim to provide the capabilities of both AWS Security Groups and some aspects of NACLs within a single, stateful framework.
Practical impacts, what this means for you
Understanding these architectural choices has real-world consequences for how you design and manage your network security.
Stateful deny is a GCP convenience: One notable practical difference is how you handle explicit “deny” scenarios. In GCP, creating a stateful “deny” rule is straightforward. If you want to block a specific group of VMs from making outbound connections on a particular port, you create a deny rule, and the stateful nature means you generally don’t have to worry about inadvertently blocking legitimate return traffic for other allowed connections. In AWS, achieving an explicit, targeted deny often involves using the stateless NACLs, which requires more careful management of return traffic.
A peek at default settings:
AWS: When you launch a new EC2 instance, its default Security Group typically blocks all incoming traffic (no uninvited guests) but allows all outgoing traffic (meaning your instance has the permission to reach out, and if it’s in a public subnet with a route to an Internet Gateway, it can indeed connect to the internet). The default NACL for your subnet, however, starts by allowing all traffic in and out. So, your instance’s “doorman” is initially strict, but the “neighborhood gate” is open.
GCP: A new GCP VPC network has implied rules: deny all incoming traffic and allow all outgoing traffic. However, if you use the “default” network that GCP often creates for new projects, it comes with some pre-populated permissive firewall rules, such as allowing SSH access from any IP address. It’s like your new apartment has a few general visitor passes already active; you’ll want to review these and decide if they fit your security posture. review these and decide if they fit your security posture.
Seeing the traffic flow logging and monitoring: Both platforms offer ways to see what your network guards are doing. AWS provides VPC Flow Logs, which can capture information about the IP traffic going to and from network interfaces in your VPC. GCP also has VPC Flow Logs, and importantly, its Firewall Rules Logging feature allows you to log when specific firewall rules are hit, giving you direct insight into which rules are allowing or denying traffic.
Real-world scenario blocking web access
Let’s make this concrete. Suppose you want to prevent a specific set of VMs from accessing external websites via HTTP (port 80) and HTTPS (port 443).
In GCP:
You would create a single VPC Firewall Rule.
Set its Direction to Egress (for outgoing traffic).
Set the Action on match to Deny.
For Targets, you’d specify your VMs, perhaps using a network tag like “no-web-access”.
For Destination filters, you’d typically use 0.0.0.0/0 (to apply to all external destinations).
For Protocols and ports, you’d list tcp:80 and tcp:443.
You’d assign this rule a Priority that is numerically lower (meaning higher precedence) than any general “allow outbound” rules that might exist, ensuring this deny rule is evaluated first.
This approach is quite direct. The rule explicitly denies the specified outbound traffic for the targeted VMs, and GCP’s stateful handling simplifies things.
In AWS:
To achieve a similar explicit block, you would most likely turn to Network ACLs:
You’d identify or create an NACL associated with the subnet(s) where your target EC2 instances reside.
You would add outbound rules to this NACL to explicitly Deny traffic destined for TCP ports 80 and 443 from the source IP range of your instances (or 0.0.0.0/0 from those instances if they are NATed).
Because NACLs are stateless, you’d also need to ensure your inbound NACL rules don’t inadvertently block legitimate return traffic for other connections if you’re not careful, though for an outbound deny, the primary concern is the outbound rule itself.
Alternatively, with Security Groups in AWS, you wouldn’t create an explicit “deny” rule. Instead, you would ensure that no outbound rule in any Security Group attached to those instances allows traffic on TCP ports 80 and 443 to 0.0.0.0/0. If there’s no “allow” rule, the traffic is implicitly denied by the Security Group. This is less of an explicit block and more of a “lack of permission.”
The AWS method, particularly if relying on NACLs for the explicit deny, often requires a bit more careful consideration of the stateless nature and rule ordering.
Charting your cloud security course
So, we’ve seen that AWS and GCP, while both aiming for robust network security, take different paths to get there. AWS offers a distinctly layered defense: Security Groups serve as your instance-specific, stateful guardians, while Network ACLs provide a broader, stateless patrol at your subnet borders. This gives you two independent levers to pull.
GCP, conversely, champions a more unified system with its VPC Firewall Rules. These are stateful, apply at the instance level, and critically, incorporate the ability to explicitly deny traffic, consolidating functionalities that are separate in AWS. The addition of Hierarchical Firewall Policies then allows for overarching governance.
Neither of these architectural philosophies is inherently superior. They represent different ways of thinking about the same fundamental challenge: controlling network traffic. The “best” approach is the one that aligns with your organization’s operational preferences, your team’s expertise, and the specific security requirements of your applications.
By understanding these core distinctions, the layers, the statefulness, and the locus of control, you’re better equipped. You’re not just choosing a cloud provider; you’re consciously architecting your digital defenses, rule by rule, ensuring your corner of the cloud remains secure and resilient.
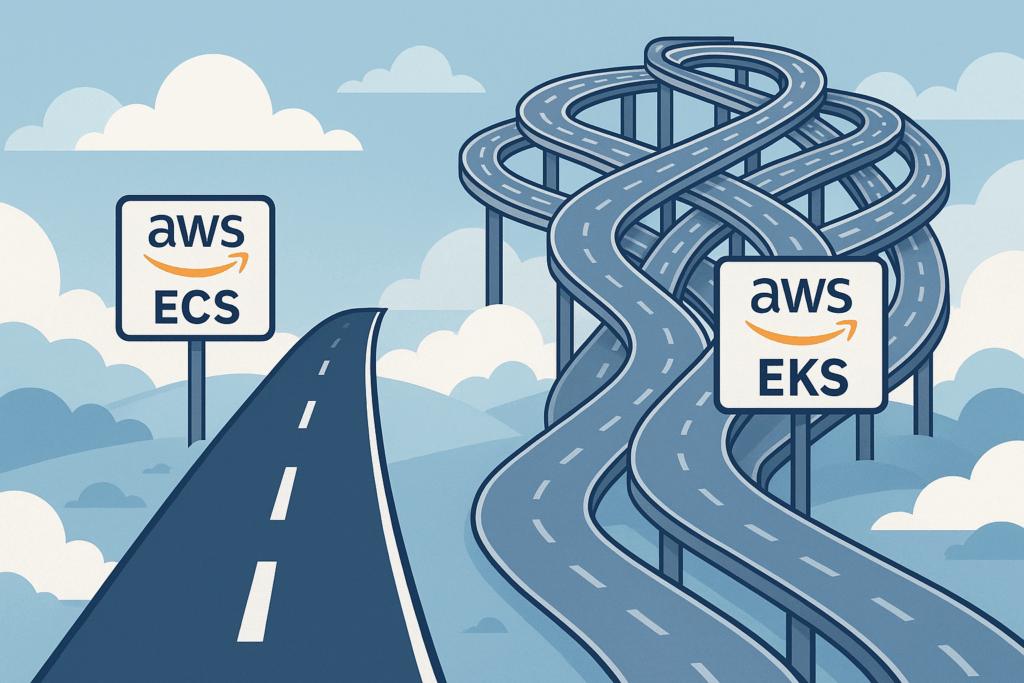
Selecting the right tools often feels like navigating a crossroads. Consider planning a significant project, like building a custom home workshop. You could opt for a complex setup with specialized, industrial-grade machinery (powerful, flexible, demanding maintenance and expertise). Or, you might choose high-quality, standard power tools that handle 90% of your needs reliably and with far less fuss. Development teams deploying containers on AWS face a similar decision. The powerful, industry-standard Kubernetes via Elastic Kubernetes Service (EKS) beckons, but is it always the necessary path? Often, the streamlined native solution, Elastic Container Service (ECS) paired with its serverless Fargate launch type, offers a smarter, more efficient route.
AWS presents these two primary highways for container orchestration. EKS delivers managed Kubernetes, bringing its vast ecosystem and flexibility. It frequently dominates discussions and is hailed in the DevOps world. But then there’s ECS, AWS’s own mature and deeply integrated orchestrator. This article explores the compelling scenarios where choosing the apparent simplicity of ECS, particularly with Fargate, isn’t just easier; it’s strategically better.
Getting to know your AWS container tools
Before charting a course, let’s clarify what each service offers.
ECS (Elastic Container Service): Think of ECS as the well-designed, built-in toolkit that comes standard with your AWS environment. It’s AWS’s native container orchestrator, designed for seamless integration. ECS offers two ways to run your containers:
EC2 launch type: You manage the underlying EC2 virtual machine instances yourself. This gives you granular control over the instance type (perhaps you need specific GPUs or network configurations) but brings back the responsibility of patching, scaling, and managing those servers.
Fargate launch type: This is the serverless approach. You define your container needs, and Fargate runs them without you ever touching, or even seeing, the underlying server infrastructure.
Fargate: This is where serverless container execution truly shines. It’s like setting your high-end camera to an intelligent ‘auto’ mode. You focus on the shot (your application), and the camera (Fargate) expertly handles the complex interplay of aperture, shutter speed, and ISO (server provisioning, scaling, patching). You simply run containers.
EKS (Elastic Kubernetes Service): EKS is AWS’s managed offering for the Kubernetes platform. It’s akin to installing a professional-grade, multi-component software suite onto your operating system. It provides immense power, conforms to the Kubernetes standard loved by many, and grants access to its sprawling ecosystem of tools and extensions. However, even with AWS managing the control plane’s availability, you still need to understand and configure Kubernetes concepts, manage worker nodes (unless using Fargate with EKS, which adds its own considerations), and handle integrations.
The power of keeping things simple with ECS Fargate
So, what makes this simpler path with ECS Fargate so appealing? Several key advantages stand out.
Reduced operational overhead: This is often the most significant win. Consider the sheer liberation Fargate offers: it completely removes the burden of managing the underlying servers. Forget patching operating systems at 2 AM or figuring out complex scaling policies for your EC2 fleet. It’s the difference between owning a car, with all its maintenance chores, oil changes, tire rotations, and unexpected repairs, and using a seamless rental or subscription service where the vehicle is just there when you need it, ready to drive. You focus purely on the journey (your application), not the engine maintenance (the infrastructure).
Faster learning curve and easier management: ECS generally presents a gentler learning curve than the multifaceted world of Kubernetes. For teams already comfortable within the AWS ecosystem, ECS concepts feel intuitive and familiar. Managing task definitions, services, and clusters in ECS is often more straightforward than navigating Kubernetes deployments, services, pods, and the YAML complexities involved. This translates to faster onboarding and less time spent wrestling with the orchestrator itself. Furthermore, EKS carries an hourly cost for its control plane (though free tiers exist), an expense absent in the standard ECS setup.
Seamless AWS integration: ECS was born within AWS, and it shows. Its integration with other AWS services is typically tighter and simpler to configure than with EKS. Assigning IAM roles directly to ECS tasks for granular permissions, for instance, is remarkably straightforward compared to setting up Kubernetes Service Accounts and configuring IAM Roles for Service Accounts (IRSA) with an OIDC provider in EKS. Connecting to Application Load Balancers, registering targets, and pushing logs and metrics to CloudWatch often requires less configuration boilerplate with ECS/Fargate. It’s like your home’s electrical system being designed for standard plugs, appliances just work without needing special adapters or wiring.
True serverless container experience (Fargate): With Fargate, you pay for the vCPU and memory resources your containerized application requests, consumed only while it’s running. You aren’t paying for idle virtual machines waiting for work. This model is incredibly cost-effective for applications with variable loads, APIs that scale on demand, or batch jobs that run periodically.
Finding your route when ECS Fargate is the best fit
Knowing these advantages, let’s pinpoint the specific road signs indicating ECS/Fargate is the right direction for your team and application.
Teams prioritizing simplicity and velocity: If your primary goal is to ship features quickly and minimize the time spent on infrastructure management, ECS/Fargate is a strong contender. It allows developers to focus more on code and less on orchestration intricacies. It’s like choosing a reliable microwave and stove for everyday cooking; they get the job done efficiently without the complexity of a commercial kitchen setup.
Standard microservices or web applications: Many common workloads, like stateless web applications, APIs, or backend microservices, don’t require the advanced orchestration features or the specific tooling found only in the Kubernetes ecosystem. For these, ECS/Fargate provides robust, scalable, and reliable hosting without unnecessary complexity.
Deep reliance on the AWS ecosystem: If your application heavily leverages other AWS services (like DynamoDB, SQS, Lambda, RDS) and multi-cloud portability isn’t an immediate strategic requirement, ECS/Fargate’s native integration offers tangible benefits in ease of use and configuration.
Serverless-First architectures: For teams embracing a serverless mindset for event-driven processing, data pipelines, or API backends, Fargate fits perfectly. Its pay-per-use model and elimination of server management align directly with serverless principles.
Operational cost sensitivity: When evaluating the total cost of ownership, factor in the human effort. The reduced operational burden of ECS/Fargate can lead to significant savings in staff time and effort, potentially outweighing any differences in direct compute costs or the EKS control plane fee.
Acknowledging the alternative when EKS remains the champion
Of course, EKS exists for good reasons, and it remains the superior choice in certain contexts. Let’s be clear about when you need that powerful, customizable machinery.
Need for Kubernetes Standard/API: If your team requires the full Kubernetes API, needs specific Custom Resource Definitions (CRDs), operators, or advanced scheduling capabilities inherent to Kubernetes, EKS is the way to go.
Leveraging the vast Kubernetes ecosystem: Planning to use popular Kubernetes-native tools like Helm for packaging, Argo CD for GitOps, Istio or Linkerd for a service mesh, or specific monitoring agents designed for Kubernetes? EKS provides the standard platform these tools expect.
Existing Kubernetes expertise or workloads: If your team is already proficient in Kubernetes or you’re migrating existing Kubernetes applications to AWS, sticking with EKS leverages that investment and knowledge, ensuring consistency.
Hybrid or Multi-Cloud strategy: When running workloads across different cloud providers or in hybrid on-premises/cloud environments, Kubernetes (and thus EKS on AWS) provides a consistent orchestration layer, crucial for portability and operational uniformity.
Highly complex orchestration needs: For applications demanding intricate network policies (e.g., using Calico), complex stateful set management, or very specific affinity/anti-affinity rules that might be more mature or flexible in Kubernetes, EKS offers greater depth.
Think of EKS as that specialized, heavy-duty truck. It’s indispensable when you need to haul unique, heavy loads (complex apps), attach specialized equipment (ecosystem tools), modify the engine extensively (custom controllers), or drive consistently across varied terrains (multi-cloud).
Choosing your lane ECS Fargate or EKS
The key insight here isn’t about crowning one service as universally “better.” It’s about recognizing that the AWS container landscape offers different tools meticulously designed for different journeys. ECS with Fargate stands as a powerful, mature, and often much simpler alternative, decisively challenging the notion that Kubernetes via EKS should be the default starting point for every containerized application on AWS.
Before committing, honestly assess your application’s real complexity, your team’s operational capacity, and existing expertise, your reliance on the broader AWS vs. Kubernetes ecosystems, and your strategic goals regarding portability. It’s like packing for a trip: you wouldn’t haul mountaineering equipment for a relaxing beach holiday. Choose the toolset that minimizes friction, maximizes your team’s velocity, and keeps your journey smooth. Choose wisely.
Podman has emerged as a prominent technology among DevOps professionals, system architects, and infrastructure teams, significantly influencing the way containers are managed and deployed. Podman, standing for “Pod Manager,” introduces a modern, secure, and efficient alternative to traditional container management approaches like Docker. It effectively addresses common challenges related to overhead, security, and scalability, making it a compelling choice for contemporary enterprises.
With the rapid adoption of cloud-native technologies and the widespread embrace of Kubernetes, Podman offers enhanced compatibility and seamless integration within these advanced ecosystems. Its intuitive, user-centric design simplifies workflows, enhances stability, and strengthens overall security, allowing organizations to confidently deploy and manage containers across various environments.
Core differences between Podman and Docker
Daemonless vs Daemon architecture
Docker relies on a centralized daemon, a persistent background service managing containers. The disadvantage here is clear: if this daemon encounters a failure, all containers could simultaneously go down, posing significant operational risks. Podman’s daemonless architecture addresses this problem effectively. Each container is treated as an independent, isolated process, significantly reducing potential points of failure and greatly improving the stability and resilience of containerized applications.
Additionally, Podman simplifies troubleshooting and debugging, as any issues are isolated within individual processes, not impacting an entire network of containers.
Rootless container execution
One notable advantage of Podman is its ability to execute containers without root privileges. Historically, Docker’s default required elevated permissions, increasing the potential risk of security breaches. Podman’s rootless capability enhances security, making it highly suitable for multi-user environments and regulated industries such as finance, healthcare, or government, where compliance with stringent security standards is critical.
This feature significantly simplifies audits, easing administrative efforts and substantially minimizing the potential for security breaches.
Performance and resource efficiency
Podman is designed to optimize resource efficiency. Unlike Docker’s continuously running daemon, Podman utilizes resources only during active container use. This targeted approach makes Podman particularly advantageous for edge computing scenarios, smaller servers, or continuous integration and delivery (CI/CD) pipelines, directly translating into cost savings and improved system performance.
Moreover, Podman supports organizations’ sustainability objectives by reducing unnecessary energy usage, contributing to environmentally conscious IT practices.
Flexible networking with CNI
Podman employs the Container Network Interface (CNI), a standard extensively used in Kubernetes deployments. While CNI might initially require more configuration effort than Docker’s built-in networking, its flexibility significantly eases the transition to Kubernetes-driven environments. This adaptability makes Podman highly valuable for organizations planning to migrate or expand their container orchestration strategies.
Compatibility and seamless transition from Docker
A key advantage of Podman is its robust compatibility with Docker images and command-line tools. Transitioning from Docker to Podman is typically straightforward, requiring minimal adjustments. This compatibility allows DevOps teams to retain familiar workflows and command structures, ensuring minimal disruption during migration.
Moreover, Podman fully supports Dockerfiles, providing a smooth transition path. Here’s a straightforward example demonstrating Dockerfile compatibility with Podman:
FROM alpine:latest

RUN apk update && apk add --no-cache curl

CMD ["curl", "--version"]
Building and running this container in Podman mirrors the Docker experience:
podman build -t myimage .
podman run myimage
This seamless compatibility underscores Podman’s commitment to a user-centric approach, prioritizing ease of transition and ongoing operational productivity.
Enhanced security capabilities
Podman offers additional built-in security enhancements beyond rootless execution. By integrating standard Linux security mechanisms such as SELinux, AppArmor, and seccomp profiles, Podman ensures robust container isolation, safeguarding against common vulnerabilities and exploits. This advanced security model simplifies compliance with rigorous security standards and significantly reduces the complexity of maintaining secure container environments.
These security capabilities also streamline security audits, enabling teams to identify and mitigate potential vulnerabilities proactively and efficiently.
Looking ahead with Podman
As container technology evolves rapidly, staying updated with innovative solutions like Podman is essential for DevOps and system architecture professionals. Podman addresses critical challenges associated with Docker, offering improved security, enhanced performance, and seamless Kubernetes compatibility.
Embracing Podman positions your organization strategically, equipping teams with superior tools for managing container workloads securely and efficiently. In the dynamic landscape of modern DevOps, adopting forward-thinking technologies such as Podman is key to sustained operational success and long-term growth.
Podman is more than an alternative—it’s the next logical step in the evolution of container technology, bringing greater reliability, security, and efficiency to your organization’s operations.
The world today runs on data. Every click, purchase, or message we send creates data, and we’re practically drowning in it. However, raw data alone isn’t helpful. Data engineering transforms this flood of information into valuable insights.
Think of data as crude oil. It is certainly valuable, but in its raw form, it’s thick, messy goo. It must be refined before it fuels anything useful. Similarly, data needs processing before it can power informed decisions. This essential refinement process is exactly what data engineering does, turning chaotic, raw data into structured, actionable information.
Without data engineering, businesses face data chaos; analysts might wait endlessly for data, or executives might make decisions blindly without reliable information. Good data engineering eliminates these issues, ensuring data flows efficiently and reliably.
Understanding what Data Engineering is
Data engineering is the hidden machinery that makes data useful for analysis. It involves building robust pipelines, efficient storage solutions, diligent data cleaning, and thorough preparation. Everything needed to move data from its source to its destination neatly and effectively.
A good data engineer is akin to a plumber laying reliable pipes, a janitor diligently cleaning up messes, and an architect ensuring the entire system remains stable and scalable. They create critical infrastructure that data scientists and analysts depend on daily.
Journey of a piece of data
Data undergoes an intriguing journey from creation to enabling insightful decisions. Let’s explore this journey step by step:
Origin of Data
Data arises everywhere, continuously and relentlessly:
People interacting with smartphones
Sensors operating in factories
Transactions through online shopping
Social media interactions
Weather stations reporting conditions
Data arrives continuously in countless formats, structured data neatly organized in tables, free-form text, audio, images, or even streaming video.
Capturing the Data
Effectively capturing this torrent of information is critical. Data ingestion is like setting nets in a fast-flowing stream, carefully catching exactly what’s needed. Real-time data, such as stock prices, requires immediate capture, while batch data, like daily sales reports, can be handled more leisurely.
The key challenge is managing diverse data formats and varying speeds without missing crucial information.
Finding the Right Storage
Captured data requires appropriate storage, typically in three main types:
Databases (SQL): Structured repositories for transactional data, like MySQL or PostgreSQL.
Data Lakes: Large, flexible storage systems such as Amazon S3 or Azure Data Lake, storing raw data until it’s needed.
Data Warehouses: Optimized for rapid analysis, combining organizational clarity and flexibility, exemplified by platforms like Snowflake, BigQuery, and Redshift.
Choosing the right storage solution depends on intended data use, volume, and accessibility requirements. Effective storage ensures data stays secure, readily accessible, and scalable.
Transforming Raw Data
Raw data often contains inaccuracies like misspelled names, incorrect date formats, duplicate records, and missing information. Data processing cleans and transforms this messy data into actionable insights. Processing might involve:
Integrating data from multiple sources
Computing new, derived fields
Summarizing detailed transactions
Normalizing currencies and units
Extracting features for machine learning
Through careful processing, data transforms from mere potential into genuine value.
Extracting Valuable Insights
This stage brings the real payoff. Organized and clean data allows analysts to detect trends, enables data scientists to create predictive models, and helps executives accurately track business metrics. Effective data engineering streamlines this phase significantly, providing reliable and consistent results.
Ensuring Smooth Operations
Data systems aren’t “set and forget.” Pipelines can break, formats can evolve, and data volumes can surge unexpectedly. Continuous monitoring identifies issues early, while regular maintenance ensures everything runs smoothly.
Exploring Data Storage in greater detail
Let’s examine data storage options more comprehensively:
Traditional SQL Databases
Relational databases such as MySQL and PostgreSQL remain powerful because they:
Enforce strict rules for clean data
Easily manage complex relationships
Ensure reliability through ACID properties (Atomicity, Consistency, Isolation, Durability)
Provide SQL, a powerful querying language
SQL databases are perfect for transactional systems like banking or e-commerce platforms.
Versatile NoSQL Databases
NoSQL databases emerged to manage massive data volumes flexibly and scalably, with variants including:
Document Databases (MongoDB): Ideal for semi-structured or unstructured data.
Key-Value Stores (Redis): Perfect for quick data access and caching.
Graph Databases (Neo4j): Excellent for data rich in relationships, like social networks.
Column-Family Databases (Cassandra): Designed for high-volume, distributed data environments.
NoSQL databases emphasize scalability and flexibility, often compromising some consistency for better performance.
Selecting Between SQL and NoSQL
There isn’t a universally perfect choice; decisions depend on specific use cases:
Choose SQL when data structure remains stable, consistency is critical, and relationships are complex.
Choose NoSQL when data structures evolve quickly, scalability is paramount, or data is distributed geographically.
The CAP theorem helps balance consistency, availability, and partition tolerance to guide this decision.
Mastering the ETL process
ETL (Extract, Transform, Load) describes moving data efficiently from source systems to analytical environments:
Extract
Collect data from various sources like databases, APIs, logs, or web scrapers.
Transform
Cleanse and structure data by removing inaccuracies, standardizing formats, and eliminating duplicates.
Load
Move processed data into analytical systems, either by fully refreshing or incrementally updating.
Modern tools like Apache Airflow, NiFi, and dbt greatly enhance the efficiency and effectiveness of the ETL process.
Impact of cloud computing
Cloud computing has dramatically reshaped data engineering. Instead of maintaining costly infrastructure, businesses now rent exactly what’s needed. Cloud providers offer complete solutions for:
Data ingestion
Scalable storage
Efficient processing
Analytical warehousing
Visualization and reporting
Cloud computing offers instant scalability, cost efficiency, and access to advanced technology, allowing engineers to focus on data challenges rather than infrastructure management. Serverless computing further simplifies this process by eliminating server-related concerns.
Essential tools for Data Engineers
Modern data engineers use several essential tools, including:
Python: Versatile and practical for various data tasks.
SQL: Crucial for structured data queries.
Apache Spark: Efficiently processes large datasets.
Apache Airflow: Effectively manages complex data pipelines.
dbt: Incorporates software engineering best practices into data transformations.
Together, these tools form reliable and robust data systems.
The future of Data Engineering
Data engineering continues to evolve rapidly:
Real-time data processing is becoming standard.
DataOps encourages collaboration and automation.
Data mesh decentralizes data ownership.
MLOps integrates machine learning models seamlessly into production environments.
Ultimately, effective data engineering ensures reliable and efficient data flow, crucial for informed business decisions.
Summarizing
Data engineering may lack glamour, but it serves as the essential backbone of modern organizations. Without it, even the most advanced data science projects falter, resulting in misguided decisions. Reliable data engineering ensures timely and accurate data delivery, empowering analysts, data scientists, and executives alike. As businesses become increasingly data-driven, strong data engineering capabilities become not just beneficial but essential for competitive advantage and sustainable success.
In short, investing in excellent data engineering is one of the most strategic moves an organization can make.
First up, let’s shine a spotlight on these two powerhouses:
AWS IAM (Identity and Access Management): Picture this as the ultimate bouncer at the hottest club in town; let’s call it Club AWS. AWS IAM is all about who gets into the VIP section: those precious AWS resources like EC2 instances, S3 buckets, and Lambda functions. It’s your tool to create users, assemble groups, and wield permissions with the precision of a laser beam, deciding who can enter and what they can touch.
Azure AD (Active Directory): Now, imagine a super-bouncer with a clipboard that covers not just one club but an entire network of venues. Azure AD is Microsoft’s cloud-based identity maestro, managing access across a sprawling galaxy of services, think Office 365, Azure itself, and even thousands of third-party apps. It’s the Swiss Army knife of identity management, juggling credentials like a cosmic DJ spinning tracks for the multiverse.
The cosmic differences
So, what sets these two apart? Let’s break it down into bite-sized, star-sized chunks:
Scope: AWS IAM is a specialist honed in on the AWS ecosystem, as if it were a hawk guarding its nest. Azure AD? It’s the broad-visioned explorer, managing identities across Microsoft’s empire and beyond, easily reaching into third-party territories.
Features: Both bring heavy-hitting security—multi-factor authentication is their shared superpower. But Azure AD ups the ante with conditional access policies, letting you say, “Only let them in if they’re calling from a trusted galaxy or wielding the right device.”
Integration: AWS IAM is the loyal sidekick to AWS services, meshing seamlessly with its kin. Azure AD, though, is the extroverted networker, linking up with Microsoft 365, Azure, and a constellation of SaaS apps—think of it as the life of the cloud party.
User Management: AWS IAM keeps it tight, handling users and roles within the AWS kingdom. Azure AD goes wide, overseeing users and groups across your entire organization—cloud, on-premises, you name it.
Authentication and Authorization: Both are fortress-strong, but Azure AD flexes extra muscle with advanced features that adapt to the chaos of the digital cosmos.
Which reigns supreme?
Now, here comes the supernova query: Which one is better? Hold onto your hats because this isn’t a one-size-fits-all answer; it’s more like choosing between a lightsaber and a sonic screwdriver. Context is everything!
Team AWS IAM: If your universe revolves around AWS, IAM is your trusty guide. It’s deeply woven into the AWS fabric, offering pinpoint control over your resources. It’s the master key to your AWS kingdom.
Team Azure AD: If you’re dreaming of a broader empire, one that spans Microsoft services and a galaxy of apps, Azure AD is your universal remote. It shines brightest in Microsoft-centric worlds or when you need versatility across platforms.
Here’s a mind-blowing nugget to ponder: Azure AD keeps the gates for over 200,000 organizations worldwide. That’s like being the bouncer for every club in a sprawling, intergalactic mega-city!
The verdict (with a twist)
So, who wins this cosmic clash? AWS IAM is a champ in its domain, unrivaled for AWS loyalists. But Azure AD? It’s the disruptor, the game-changer, edging ahead with its flexibility and integration prowess. It’s not just a tool; it’s a bridge to the future of identity management.
But here’s the kicker: the “better” choice is the one that fits your orbit. Are you locked into AWS, or are you roaming the wilds of a multi-cloud universe? That’s the real question.
What’s your take, cosmic travelers? Are you Team AWS IAM, guarding the VIP lounge, or Team Azure AD, rewriting the rules of the cloud? Drop your thoughts below, I’m all ears for this interstellar debate!
You know your computer, right? That trusty machine, maybe running Windows, macOS, or perhaps a flavor of Linux like my buddy Fernando rocks with his Ubuntu setup. It has an Operating System. Its job? To manage the guts of that one machine, the processor, the memory, the storage, making sure your apps can run, your files are saved. It’s the conductor of a small, personal orchestra.
Now… zoom out. Way out.
Imagine not one computer but thousands. Tens of thousands. Maybe millions. Housed in colossal buildings we call data centers, spread across the globe, all interconnected. A sprawling, humming galaxy of computation.
How do you manage that? You can’t just install Windows on the entire internet! That’s like trying to run a city using the rules of a single household. It just doesn’t scale.
Meet the Cloud Operating System.
Now, hold on, don’t picture a single piece of software called “CloudOS” that you download. It’s more fundamental, more… cosmic in its scope. Think of it less as the OS on a single server in the cloud (that’s often still Linux or Windows), and more like the overarching intelligence, the distributed brain managing the entire fleet, the whole data center, maybe even multiple data centers as one cohesive entity.
What does this cosmic brain do? It performs a symphony of coordination on a scale that would make your desktop OS blush:
It Abstracts the Hardware: It takes all those individual servers, storage racks, networking gear, the raw physical stuff, and throws a kind of “invisibility cloak” over it. It presents it all as a unified, seemingly infinite pool of resources. You ask for processing power, memory, storage, and the Cloud OS figures out where in that vast physical infrastructure to get it from, without you needing to know or care about the specific box. It’s like asking for “water” and the system handles whether it comes from this reservoir or that aquifer.
It Orchestrates Resources: Need to spin up a thousand virtual servers for a massive calculation? Boom. The Cloud OS handles the provisioning, allocation, and networking. Need to automatically scale your website’s capacity because you just went viral? The Cloud OS is the maestro making that happen seamlessly. It’s the ultimate traffic controller, resource allocator, and taskmaster for the entire digital city.
It Manages Virtualization: This is key. Cloud OSes are masters of virtualization, carving up physical machines into multiple virtual ones (VMs) or pooling resources to make many machines act as one giant one. It’s about turning rigid hardware into a flexible, fluid resource.
It Provides Essential Services: Think scheduling (what runs where and when), storage management (replicating data for safety, moving it for speed), network management (directing traffic flow), fault tolerance (if one server fails, the system barely notices), and massive automation (because no army of humans could manage this manually).
So, can you point to one specific “Cloud Operating System”? Well, it’s complicated. The giants, Amazon AWS, Microsoft Azure, and Google Cloud Platform, have built their own incredibly sophisticated, largely proprietary systems that act as the planet-scale operating systems for their clouds. Projects like OpenStack aim to provide an open-source framework to build this kind of cloud management system. And technologies like Kubernetes, while often called a “container orchestrator,” are essentially performing many of the distributed operating system functions at the application layer within the cloud.
Why is this disruptive? Because it fundamentally broke the old model of computing. We went from being limited by the box on our desk to tapping into near-limitless resources on demand. The Cloud OS is the unsung hero behind this revolution, the invisible intelligence weaving together the fabric of the modern digital world. It’s not just managing silicon and wires; it’s managing possibility on an unprecedented scale.
Think about that the next time you access a file from anywhere or watch a video streamed from the ether. You’re witnessing the silent, elegant dance orchestrated by a Cloud Operating System.
Hope that expands your view of the computational cosmos! Keep looking up… and into the cloud.
When you first start using Kubernetes, Pods might seem straightforward. Initially, they look like simple containers grouped, right? But hidden beneath this simplicity are powerful techniques that can elevate your Kubernetes deployments from merely functional to exceptionally robust, efficient, and secure. Let’s explore these advanced Kubernetes Pod concepts and empower DevOps engineers, Site Reliability Engineers (SREs), and curious developers to build better, stronger, and smarter systems.
Multi-Container Pods, a Closer Look
Beginners typically deploy Pods containing just one container. But Kubernetes offers more: you can bundle several containers within a single Pod, letting them efficiently share resources like network and storage.
Sidecar pattern in Action
Imagine giving your application a helpful partner, that’s what a sidecar container does. It’s like having a dependable assistant who quietly manages important details behind the scenes, allowing you to focus on your primary tasks without distraction. A sidecar container handles routine but essential responsibilities such as logging, monitoring, or data synchronization, tasks your main application shouldn’t need to worry about directly. For instance, while your main app engages users, responds to requests, and processes transactions, the sidecar can quietly collect logs and forward them efficiently to a logging system. This clever separation of concerns simplifies development and enhances reliability by isolating additional functionality neatly alongside your main application.
Adapters are essentially translators, they take your application’s outputs and reshape them into forms that other external systems can easily understand. Think of them as diplomats who speak the language of multiple systems, bridging communication gaps effortlessly. Ambassadors, on the other hand, serve as intermediaries or dedicated representatives, handling external interactions on behalf of your main container. Imagine your application needing frequent access to an external API; the ambassador container could manage local caching and simplify interactions, reducing latency and speeding up response times dramatically. Both adapters and ambassadors cleverly streamline integration and improve overall system efficiency by clearly defining responsibilities and interactions.
Init containers, setting the stage
Before your Pod kicks into gear and starts its primary job, there’s usually a bit of groundwork to lay first. Just as you might check your toolbox and gather your materials before starting a project, init containers take care of essential setup tasks for your Pods. These handy containers run before the main application container and handle critical chores such as verifying database connections, downloading necessary resources, setting up configuration files, or tweaking file permissions to ensure everything is in the right state. By using init containers, you’re ensuring that when your application finally says, “Ready to go!”, it is ready, avoiding potential hiccups and smoothing out your application’s startup process.
Strengthening Pod stability with disruption budgets
Pods aren’t permanent; they can be disrupted by routine maintenance or unexpected failures. Pod Disruption Budgets (PDBs) keep services running smoothly by ensuring a minimum number of Pods remain active, even during disruptions.
This setup ensures Kubernetes maintains at least two active Pods at all times.
Scheduling mastery with Pod affinity and anti-affinity
Affinity and anti-affinity rules help Kubernetes make smart decisions about Pod placement, almost as if the Pods themselves have preferences about where they want to live. Think of affinity rules as Pods that prefer to hang out together because they benefit from proximity, like friends working better in the same office. For instance, clustering database Pods together helps reduce latency, ensuring faster communication. On the other hand, anti-affinity rules act more like Pods that prefer their own space, spreading frontend Pods across multiple nodes to ensure that if one node experiences trouble, others continue operating smoothly. By mastering these strategies, you enable Kubernetes to optimize your application’s performance and resilience in a thoughtful, almost intuitive manner.
Affinity example (Grouping Together):
affinity:
  podAffinity:
    requiredDuringSchedulingIgnoredDuringExecution:
    - labelSelector:
        matchExpressions:
        - key: role
          operator: In
          values:
          - database
      topologyKey: "kubernetes.io/hostname"
Anti-Affinity example (Spreading Apart):
affinity:
  podAntiAffinity:
    requiredDuringSchedulingIgnoredDuringExecution:
    - labelSelector:
        matchExpressions:
        - key: role
          operator: In
          values:
          - webserver
      topologyKey: "kubernetes.io/hostname"
Pod health checks. Readiness, Liveness, and Startup Probes
Kubernetes regularly checks the health of your Pods through:
Readiness Probes: Confirm your Pod is ready to handle traffic.
Liveness Probes: Continuously check Pod responsiveness and restart if necessary.
Startup Probes: Give Pods ample startup time before running other probes.
Pods need resources like CPU and memory, much like how you need food and energy to stay productive throughout the day. But just as you shouldn’t overeat or exhaust yourself, Pods should also be careful with resource usage. Kubernetes provides an elegant solution to this challenge by letting you politely request the resources your Pod requires and firmly setting limits to prevent excessive consumption. This thoughtful management ensures every Pod gets its fair share, maintaining harmony in the shared environment, and helping prevent resource-starvation issues that could slow down or disrupt the entire system.
Precise Pod scheduling with taints and tolerations
In Kubernetes, nodes sometimes have specific conditions or labels called “taints.” Think of these taints as signs on the doors of rooms saying, “Only enter if you need what’s inside.” Pods respond to these taints by using something called “tolerations,” essentially a way for Pods to say, “Yes, I recognize the conditions of this node, and I’m fine with them.” This clever mechanism ensures that Pods are selectively scheduled onto nodes best suited for their specific needs, optimizing resources and performance in your Kubernetes environment.
Ephemeral storage is like scribbling a quick note on a chalkboard, useful for temporary reminders or short-term calculations, but easily erased. When Pods restart, everything stored in ephemeral storage vanishes, making it ideal for temporary data that you won’t miss. Persistent storage, however, is akin to carefully writing down important notes in your notebook, where they’re preserved safely even after you close it. This type of storage maintains its contents across Pod restarts, making it perfect for storing critical, long-term data that your application depends on for continued operation.
Horizontal scaling is like having extra hands on deck precisely when you need them. If your application suddenly faces increased traffic, imagine a store suddenly swarming with customers, you quickly bring in additional help by spinning up more Pods. Conversely, when things slow down, you gracefully scale back to conserve resources. Vertical scaling, however, is more about fine-tuning the capabilities of each Pod individually. Think of it as providing a worker with precisely the right tools and workspace they need to perform their job efficiently. Kubernetes dynamically adjusts the resources allocated to each Pod, ensuring they always have the perfect amount of CPU and memory for their workload, no more and no less. These strategies together keep your applications agile, responsive, and resource-efficient.
Network policies act like traffic controllers for your Pods, deciding who talks to whom and ensuring unwanted visitors stay away. Imagine hosting an exclusive gathering, only guests are allowed in. Similarly, network policies permit Pods to communicate strictly according to defined rules, enhancing security significantly. For instance, you might allow only your frontend Pods to interact directly with backend Pods, preventing potential intruders from sneaking into sensitive areas. This strategic control keeps your application’s internal communications safe, orderly, and efficient.
Now imagine you’re standing in a vast workshop, tools scattered around you. At first glance, a Pod seems like a simple wooden box, unassuming, almost ordinary. But open it up, and inside you’ll find gears, springs, and levers arranged with precision. Each component has a purpose, and when you learn to tweak them just right, that humble box transforms into something extraordinary: a clock that keeps perfect time, a music box that hums symphonies, or even a tiny engine that powers a locomotive.
That’s the magic of mastering Kubernetes Pods. You’re not just deploying containers; you’re orchestrating tiny ecosystems. Think of the sidecar pattern as adding a loyal assistant who whispers, “Don’t worry about the logs, I’ll handle them. You focus on the code.” Or picture affinity rules as matchmakers, nudging Pods to cluster together like old friends at a dinner party, while anti-affinity rules act likewise parents, saying, “Spread out, kids, no crowding the kitchen!”
And what about those init containers? They’re the stagehands of your Pod’s theater. Before the spotlight hits your main app, these unsung heroes sweep the floor, adjust the curtains, and test the microphones. No fanfare, just quiet preparation. Without them, the show might start with a screeching feedback loop or a missing prop.
But here’s the real thrill: Kubernetes isn’t a rigid rulebook. It’s a playground. When you define a Pod Disruption Budget, you’re not just setting guardrails, you’re teaching your cluster to say, “I’ll bend, but I won’t break.” When you tweak resource limits, you’re not rationing CPU and memory; you’re teaching your apps to dance gracefully, even when the music speeds up.
And let’s not forget security. With Network Policies, you’re not just building walls, you’re designing secret handshakes. “Psst, frontend, you can talk to the backend, but no one else gets the password.” It’s like hosting a masquerade ball where every guest is both mysterious and meticulously vetted.
So, what’s the takeaway? Kubernetes Pods aren’t just YAML files or abstract concepts. They’re living, breathing collaborators. The more you experiment, tinkering with probes, laughing at the quirks of taints and tolerations, or marveling at how ephemeral storage vanishes like chalk drawings in the rain, the more you’ll see patterns emerge. Patterns that whisper, “This is how systems thrive.”
Will there be missteps? Of course! Maybe a misconfigured probe or a Pod that clings to a node like a stubborn barnacle. But that’s the joy of it. Every hiccup is a puzzle and every solution? A tiny epiphany. So go ahead, grab those Pods, twist them, prod them, and watch as your deployments evolve from “it works” to “it sings.” The journey isn’t about reaching perfection. It’s about discovering how much aliveness you can infuse into those lines of YAML. And trust me, the orchestra you’ll conduct? It’s worth every note.
Containers have transformed how we build, deploy, and run software. We package our apps neatly into them, toss them onto Kubernetes, and sit back as things smoothly fall into place. But hidden beneath this simplicity is a critical component quietly doing all the heavy lifting, the container runtime. Let’s explain and clearly understand what this container runtime is, why it matters, and how it helps everything run seamlessly.
What exactly is a Container Runtime?
A container runtime is simply the software that takes your packaged application and makes it run. Think of it like the engine under the hood of your car; you rarely think about it, but without it, you’re not going anywhere. It manages tasks like starting containers, isolating them from each other, managing system resources such as CPU and memory, and handling important resources like storage and network connections. Thanks to runtimes, containers remain lightweight, portable, and predictable, regardless of where you run them.
Why should you care about Container Runtimes?
Container runtimes simplify what could otherwise become a messy job of managing isolated processes. Kubernetes heavily relies on these runtimes to guarantee the consistent behavior of applications every single time they’re deployed. Without runtimes, managing containers would be chaotic, like cooking without pots and pans, you’d end up with scattered ingredients everywhere, and things would quickly get messy.
Getting to know the popular Container Runtimes
Let’s explore some popular container runtimes that you’re likely to encounter:
Docker
Docker was the original popular runtime. It played a key role in popularizing containers, making them accessible to developers and enterprises alike. Docker provides an easy-to-use platform that allows applications to be packaged with all their dependencies into lightweight, portable containers.
One of Docker’s strengths is its extensive ecosystem, including Docker Hub, which offers a vast library of pre-built images. This makes it easy to find and deploy applications quickly. Additionally, Docker’s CLI and tooling simplify the development workflow, making container management straightforward even for those new to the technology.
However, as Kubernetes evolved, it moved away from relying directly on Docker. This was mainly because Docker was designed as a full-fledged container management platform rather than a lightweight runtime. Kubernetes required something leaner that focused purely on running containers efficiently without unnecessary overhead. While Docker still works well, most Kubernetes clusters now use containerd or CRI-O as their primary runtime for better performance and integration.
containerd
Containerd emerged from Docker as a lightweight, efficient, and highly optimized runtime that focuses solely on running containers. If Docker is like a full-service restaurant—handling everything from taking orders to cooking and serving, then containerd is just the kitchen. It does the cooking, and it does it well, but it leaves the extra fluff to other tools.
What makes containerd special? First, it’s built for speed and efficiency. It strips away the unnecessary components that Docker carries, focusing purely on running containers without the added baggage of a full container management suite. This means fewer moving parts, less resource consumption, and better performance in large-scale Kubernetes environments.
Containerd is now a graduated project under the Cloud Native Computing Foundation (CNCF), proving its reliability and widespread adoption. It’s the default runtime for many managed Kubernetes services, including Amazon EKS, Google GKE, and Microsoft AKS, largely because of its deep integration with Kubernetes through the Container Runtime Interface (CRI). This allows Kubernetes to communicate with containerd natively, eliminating extra layers and complexity.
Despite its strengths, containerd lacks some of the convenience features that Docker offers, like a built-in CLI for managing images and containers. Users often rely on tools like ctr or crictl to interact with it directly. But in a Kubernetes world, this isn’t a big deal, Kubernetes itself takes care of most of the higher-level container management.
With its low overhead, strong Kubernetes integration, and widespread industry support, containerd has become the go-to runtime for modern containerized workloads. If you’re running Kubernetes today, chances are containerd is quietly doing the heavy lifting in the background, ensuring your applications start up reliably and perform efficiently.
CRI-O
CRI-O is designed specifically to meet Kubernetes standards. It perfectly matches Kubernetes’ Container Runtime Interface (CRI) and focuses solely on running containers. If Kubernetes were a high-speed train, CRI-O would be the perfectly engineered rail system built just for it, streamlined, efficient, and without unnecessary distractions.
One of CRI-O’s biggest strengths is its tight integration with Kubernetes. It was built from the ground up to support Kubernetes workloads, avoiding the extra layers and overhead that come with general-purpose container platforms. Unlike Docker or even containerd, which have broader use cases, CRI-O is laser-focused on running Kubernetes workloads efficiently, with minimal resource consumption and a smaller attack surface.
Security is another area where CRI-O shines. Since it only implements the features Kubernetes needs, it reduces the risk of security vulnerabilities that might exist in larger, more feature-rich runtimes. CRI-O is also fully OCI-compliant, meaning it supports Open Container Initiative images and integrates well with other OCI tools.
However, CRI-O isn’t without its downsides. Because it’s so specialized, it lacks some of the broader ecosystem support and tooling that containerd and Docker enjoy. Its adoption is growing, but it’s not as widely used outside of Kubernetes environments, meaning you may not find as much community support compared to the more established runtimes. Despite these trade-offs, CRI-O remains a great choice for teams that want a lightweight, Kubernetes-native runtime that prioritizes efficiency, security, and streamlined performance.
Kata Containers
Kata Containers offers stronger isolation by running containers within lightweight virtual machines. It’s perfect for highly sensitive workloads, providing a security level closer to traditional virtual machines. But this added security comes at a cost, it typically uses more resources and can be slower than other runtimes. Consider Kata Containers as placing your app inside a secure vault, ideal when security is your top priority.
gVisor
Developed by Google, gVisor offers enhanced security by running containers within a user-space kernel. This approach provides isolation closer to virtual machines without requiring traditional virtualization. It’s excellent for workloads needing stronger isolation than standard containers but less overhead than full VMs. However, gVisor can introduce a noticeable performance penalty, especially for resource-intensive applications, because system calls must pass through its user-space kernel.
Kubernetes and the Container Runtime Interface
Kubernetes interacts with container runtimes using something called the Container Runtime Interface (CRI). Think of CRI as a universal translator, allowing Kubernetes to clearly communicate with any runtime. Kubernetes sends instructions, like launching or stopping containers, through CRI. This simple interface lets Kubernetes remain flexible, easily switching runtimes based on your needs without fuss.
Choosing the right Runtime for your needs
Selecting the best runtime depends on your priorities:
Efficiency – Does it maximize system performance?
Complexity: Does it avoid adding unnecessary complications?
Security: Does it provide the isolation level your applications demand?
If security is crucial, like handling sensitive financial or medical data, you might prefer runtimes like Kata Containers or gVisor, specifically designed for stronger isolation.
Final thoughts
Container runtimes might not grab headlines, but they’re crucial. They quietly handle the heavy lifting, making sure your containers run smoothly, securely, and efficiently. Even though they’re easy to overlook, runtimes are like the backstage crew of a theater production, diligently working behind the curtains. Without them, even the simplest container deployment would quickly turn into chaos, causing applications to crash, misbehave, or even compromise security. Every time you launch an application effortlessly onto Kubernetes, it’s because the container runtime is silently solving complex problems for you. So, the next time your containers spin up flawlessly, take a moment to appreciate these hidden champions, they might not get applause, but they truly deserve it.