DevOps stuff

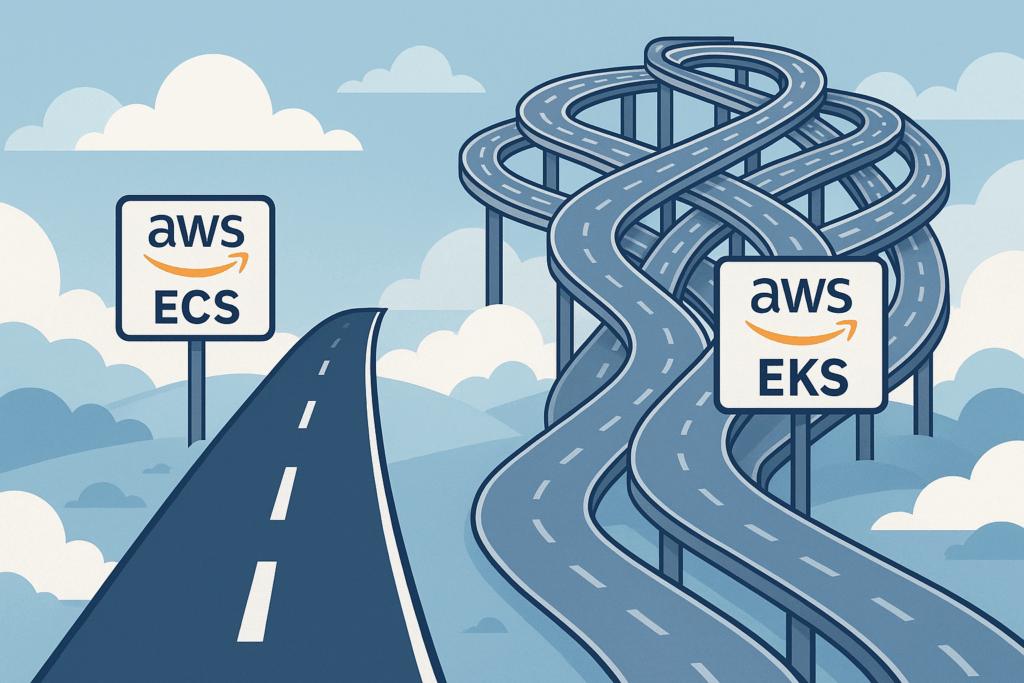
AWS Container Services Unveiled: EC2 on ECS vs Fargate Explained

In the vast ocean of cloud computing, two notable ships, AWS EC2 on ECS and Fargate, often sail together but chart different courses. This article serves as a compass to help you navigate these technologies and understand when it’s best to set sail with one or the other.

A Deeper Dive into ECS: The Heart of Container Management

Elastic Container Service (ECS) is not just an island in the AWS archipelago; it’s a bustling port city for Docker containers. ECS simplifies the way you can run, manage, and scale containerized applications.

What is ECS?

ECS is a highly scalable, high-performance container orchestration service. It supports Docker containers and allows you to easily run and scale containerized applications on AWS. ECS eliminates the need to install and operate your own container orchestration software, manage and scale a cluster of virtual machines, or schedule containers on those machines.

Popular Uses of ECS

  1. Microservices Applications: ECS is ideal for running microservices architectures due to its high scalability and performance. It allows each microservice to be packaged as a container and then managed and scaled independently.
  2. Batch Processing: For batch processing workloads, ECS efficiently manages the batch jobs, scaling up or down as needed, ensuring that your jobs are processed quickly and cost-effectively.
  3. Machine Learning: Running machine learning models in containers on ECS allows for easy scaling and management of resources, making it a popular choice for ML workloads.
  4. Continuous Integration/Continuous Deployment (CI/CD): ECS can be integrated into CI/CD pipelines, providing a consistent environment for building, testing, and deploying applications.

EC2: The Traditional Vessel

Using EC2 on ECS is akin to having your own ship. You have total control over the type of ship, its maintenance, and its navigation. This approach is perfect for those who are familiar with the seas and want complete freedom.

One example:

Deploying a Docker container for a web application on EC2 instances within ECS is like navigating familiar waters with your own fleet.

Fargate: The Automated Cruise Liner

Fargate is the automated cruise liner of the ECS world. It takes care of the ship’s steering and maintenance, allowing you to enjoy the journey. Fargate manages the underlying infrastructure, so you can focus on your containers and applications.

One example:

Running a batch processing job with multiple containers on Fargate is like specifying the number of rooms you need on a cruise liner, without worrying about the ship’s operations.

Navigational Terms in ECS

  • Task: The basic unit of deployment in ECS, representing a running Docker container.
  • Task Definition: A blueprint for your tasks, specifying Docker images, CPU, memory, and more.
  • Service: Manages the number of tasks, ensuring they are running and replacing any that fail.
  • Cluster: A logical grouping of tasks or services. In EC2, it’s a group of containers; in Fargate, it’s a group of tasks.

Friendly Guide to the Differences: EC2 on ECS vs Fargate

Navigating the choices between EC2 on ECS and Fargate can be like choosing between two advanced yachts with different features. Let’s break down their differences in a friendly, easy-to-understand manner.

Control vs Convenience: The Captain’s Dilemma

  1. Control (EC2 on ECS): Imagine being the captain of your own ship. You decide everything – from the size of the ship to the crew members. This is what EC2 on ECS offers. You have complete control over the EC2 instances that your containers run on. This means you can optimize for specific types of workloads, manage security settings, and handle the maintenance.
  2. Convenience (Fargate): Now, imagine boarding a luxury yacht where everything is taken care of for you. This is Fargate. You don’t have to worry about the underlying servers or clusters. You just specify the resources your containers need, and Fargate handles the rest. It’s like having an automated crew that takes care of all the technical details.

Performance and Scaling: The Wind in Your Sails

  1. Performance (EC2 on ECS): With EC2, you can choose instances that best fit your application needs. This is like choosing a yacht designed for speed or cargo capacity. It’s great for applications with predictable performance requirements.
  2. Scaling (Fargate): Fargate scales automatically. It’s like having a yacht that can magically resize itself based on the number of guests. This is perfect for applications with variable workloads where you might need more or less capacity at different times.

Cost Considerations: The Price of the Voyage

  1. Cost (EC2 on ECS): Using EC2 instances can be more cost-effective for long-running workloads with stable resource usage. It’s like owning a yacht – there’s an upfront investment, but it’s efficient in the long run if you use it frequently.
  2. Cost (Fargate): Fargate charges based on the resources your containers use. This is like renting a yacht only when you need it. It can be more cost-effective for short-term, sporadic, or unpredictable workloads.

Security and Compliance: Navigating the Safe Waters

  1. Security (EC2 on ECS): With EC2, you’re in charge of security. This means you can implement custom security measures tailored to your organization’s needs.
  2. Security (Fargate): Fargate provides a high level of security by default. AWS manages the security of the infrastructure, which can be a relief if you don’t have specialized security expertise.

When to Choose EC2 vs Fargate

Set Sail with EC2 on ECS When:

  1. Utilizing Existing EC2 Instances: If you already have EC2 instances, it makes sense to use them with ECS.
  2. Predictable, High Utilization Workloads: For long-running services with predictable traffic, EC2 offers cost-effectiveness and control.
  3. Need for Full Control: If your organization requires tight control over the infrastructure, EC2 is your ship.

Embark with Fargate When:

  1. Ease of Setup and Maintenance: Fargate is ideal for those who prefer to focus on the application rather than on infrastructure management.
  2. Variable, Short-Term Workloads: For tasks with unpredictable utilization or short durations, Fargate offers flexibility and efficiency.
  3. Serverless Benefits: If you’re looking for a solution that scales automatically and charges based on resource consumption, Fargate is suitable.

Parting Insights: EC2 on ECS and Fargate:

Both EC2 on ECS and Fargate offer unique advantages depending on your specific needs. EC2 provides control and is ideal for predictable, long-term workloads, while Fargate offers ease of use and flexibility for variable, short-term tasks. Understanding these differences will help you chart the right course in your cloud journey.

Kubectl Edit: Performing Magic in Kubernetes

‘Kubectl edit’ is an indispensable command-line tool for Kubernetes users, offering the flexibility to modify resource definitions dynamically. This article aims to demystify ‘Kubectl edit,’ explaining its utility and showcasing real-world applications.

What is ‘Kubectl Edit’?

‘Kubectl edit’ is a command that facilitates live edits to Kubernetes resource configurations, such as pods, services, deployments, or other resources defined in YAML files. It’s akin to wielding a magic wand, allowing you to tweak your resources without the hassle of creating or applying new configuration files.

Why is ‘Kubectl Edit’ Valuable?

  • Real-Time Configuration Changes: It enables immediate adjustments, making it invaluable for troubleshooting or adapting to evolving requirements.
  • Quick Fixes: It’s perfect for addressing issues or misconfigurations swiftly, without the need for resource deletion and recreation.
  • Experimentation: Ideal for experimenting and fine-tuning settings, helping you discover the best configurations for your applications.

Basic Syntax

The basic syntax for ‘Kubectl edit’ is straightforward:

kubectl edit <resource-type> <resource-name>
  • <resource-type>: The type of Kubernetes resource you want to edit (e.g., pod, service, deployment).
  • <resource-name>: The name of the specific resource to edit.

Real-Life Examples

Let’s explore practical examples to understand how ‘Kubectl edit’ can be effectively utilized in real scenarios.

Example 1: Modifying a Pod Configuration

Imagine needing to adjust the resource requests and limits for a pod named ‘my-pod.’ Execute:

kubectl edit pod my-pod

This command opens the pod’s configuration in your default text editor. You’ll see a YAML file similar to this:

apiVersion: v1
kind: Pod
metadata:
  name: my-pod
  ...
spec:
  containers:
  - name: my-container
    image: my-image
    resources:
      requests:
        memory: "64Mi"
        cpu: "250m"
      limits:
        memory: "128Mi"
        cpu: "500m"
  ...

In this file, focus on the resources section under containers. Here, you can modify the CPU and memory settings. For instance, to increase the CPU request to 500m and the memory limit to 256Mi, you would change the lines to:

   resources:
      requests:
        memory: "64Mi"
        cpu: "500m"
      limits:
        memory: "256Mi"
        cpu: "500m"

After making these changes, save and close the editor. Kubernetes will apply these updates to the pod ‘my-pod.’

Example 2: Updating a Deployment

To modify a deployment’s replicas or image version, use ‘kubectl edit’:

kubectl edit deployment my-deployment

This command opens the deployment’s configuration in your default text editor. You’ll see a YAML file similar to this:

apiVersion: apps/v1
kind: Deployment
metadata:
  name: my-deployment
  ...
spec:
  replicas: 3
  selector:
    matchLabels:
      app: my-app
  template:
    metadata:
      labels:
        app: my-app
    spec:
      containers:
      - name: my-container
        image: my-image:v1.0
        ports:
        - containerPort: 80
  ...

In this file, focus on the following sections:

  • To change the number of replicas, modify the replicas field. For example, to scale up to 5 replicas:
spec:
  replicas: 5
  • To update the image version, locate the image field under containers. For instance, to update to version v2.0 of your image:
 containers:
    - name: my-container
      image: my-image:v2.0

Save and close the editor and Kubernetes will apply these updates to the deployment ‘my-deployment.’

Example 3: Adjusting a Service

To fine-tune a service’s settings, such as changing the service type to LoadBalancer, you would use the command:

kubectl edit service my-service

The command will open the service’s configuration in your default text editor. You’ll likely see a YAML file similar to this:

apiVersion: v1
kind: Service
metadata:
  name: my-service
  ...
spec:
  type: ClusterIP
  selector:
    app: my-app
  ports:
    - protocol: TCP
      port: 80
      targetPort: 9376
  ...

In this file, focus on the spec section:

  • To change the service type to LoadBalancer, modify the type field. For example:
spec:
  type: LoadBalancer

This change will alter the service type from ClusterIP to LoadBalancer, enabling external access to your service.

After making these changes, save and close the editor. Kubernetes will apply these updates to the service ‘my-service.’

Real-World Example: Debugging and Quick Fixes

If a pod is crashing due to a misconfigured environment variable, something I’ve seen happen countless times, use ‘kubectl edit’ to quickly access and correct the pod’s configuration, significantly reducing the downtime.

kubectl edit pod crashing-pod

Executing such a command will open the pod’s configuration in your default text editor, and you’ll likely see a YAML file similar to this:

apiVersion: v1
kind: Pod
metadata:
  name: crashing-pod
  ...
spec:
  containers:
  - name: my-container
    image: my-image
    env:
      - name: ENV_VAR
        value: "incorrect_value"
    ...

In this file, focus on the env section under containers. Here, you can find and correct the misconfigured environment variable. For instance, if ENV_VAR is set incorrectly, you would change it to the correct value:

    env:
      - name: ENV_VAR
        value: "correct_value"

After making this change, save and close the editor. Kubernetes will apply the update, and the pod should restart without the previous configuration issue.

It’s Not Magic: Understand What Happens Behind the Scenes

When you save changes made in the editor through kubectl edit, Kubernetes doesn’t simply apply these changes magically. Instead, a series of orchestrated steps occur to ensure that your modifications are implemented correctly and safely. Let’s demystify this process:

  1. Parsing and Validation: First, Kubernetes parses the edited YAML or JSON file to ensure it’s correctly formatted. It then validates the changes against the Kubernetes API’s schema for the specific resource type. This step is crucial to prevent configuration errors from being applied.
  1. Resource Versioning: Kubernetes keeps track of the version of each resource configuration. When you save your changes, Kubernetes checks the resource version in your edited file against the current version in the cluster. This is to ensure that you’re editing the latest version of the resource and to prevent conflicts.
  1. Applying Changes: If the validation is successful and the version matches, Kubernetes proceeds to apply the changes. This is done by updating the resource’s definition in the Kubernetes API server.
  1. Rolling Updates and Restart: Depending on the type of resource and the nature of the changes, Kubernetes may perform a rolling update. For example, if you edited a Deployment, Kubernetes would start creating new pods with the updated configuration and gradually terminate the old ones, ensuring minimal disruption.
  1. Feedback Loop: Kubernetes controllers continuously monitor the state of resources. If the applied changes don’t match the desired state (for instance, if a new pod fails to start), Kubernetes attempts to rectify this by reverting to a previous, stable configuration.
  1. Status Update: Finally, the status of the resource is updated to reflect the changes. You can view this status using commands like ‘kubectl get’ or ‘kubectl describe’ to ensure that your changes have been applied and are functioning as expected.

By understanding these steps, you gain insight into the robust and resilient nature of Kubernetes’ configuration management. It’s not just about making changes; it’s about making them in a controlled, reliable manner.

In Closing

‘Kubectl edit’ is a powerful tool for optimizing Kubernetes resources, offering simplicity and efficiency. With the examples provided, you’re now equipped to confidently fine-tune settings, address issues, and experiment with configurations, ensuring the smooth and efficient operation of your Kubernetes applications.

Amazon DevOps Guru for RDS:
A Game-Changer for Database Management

Why Amazon DevOps Guru for RDS is a Game-Changer

Imagine you’re managing a critical database that supports an e-commerce platform. It’s Black Friday, and your website is experiencing unprecedented traffic. Suddenly, the database starts to slow down, and the latency spikes are causing timeouts. The customer experience is rapidly deteriorating, and every second of downtime translates to lost revenue. In such high-stress scenarios, identifying and resolving database performance issues swiftly is not just beneficial; it’s essential.

This is where Amazon DevOps Guru for RDS comes into play. It’s a new service from AWS designed to make the life of a DevOps professional easier by providing automated insights to help you understand and resolve issues with Amazon RDS databases quickly.

Proactive and Reactive Performance Issue Detection

The true power of Amazon DevOps Guru for RDS lies in its dual approach to performance issues. Proactively, it functions like an ever-vigilant sentinel, using machine learning to analyze trends and patterns that could indicate potential problems. It’s not just about catching what goes wrong, but about understanding what ‘could’ go wrong before it actually does. For instance, if your database is showing early signs of strain under increasing load, DevOps Guru for RDS can forecast this trajectory and suggest preemptive scaling or optimization to avert a crisis.

Reactively, when an issue arises, the service swiftly shifts gears from a predictive advisor to an incident responder. It correlates various metrics and logs to pinpoint the root cause, whether it’s a suboptimal query plan, an inefficient index, or resource bottlenecks. By providing a detailed diagnosis, complete with contextual insights, DevOps teams can move beyond mere symptom alleviation to implement a cure that addresses the underlying issue.

Database-Specific Tuning and Recommendations

Amazon DevOps Guru for RDS transcends the role of a traditional monitoring tool by offering a consultative approach tailored to your database’s unique operational context. It’s akin to having a dedicated database optimization expert on your team who knows the ins and outs of your RDS environment. This virtual expert continuously analyzes performance data, identifies inefficiencies, and provides specific recommendations to fine-tune your database.

For example, it might suggest parameter group changes that can enhance query performance or index adjustments to speed up data retrieval. These recommendations are not generic advice but are customized based on the actual performance data and usage patterns of your database. It’s like receiving a bespoke suit: made to measure for your database’s specific needs, ensuring it performs at its sartorial best.

Introduction to Amazon RDS and Amazon Aurora

Amazon RDS and Amazon Aurora represent the backbone of AWS’s managed database services, designed to alleviate the heavy lifting of database administration. While RDS offers a streamlined approach to relational database management, providing automated backups, patching, and scaling, Amazon Aurora takes this a step further, delivering performance that can rival commercial databases at a fraction of the cost.

Aurora, in particular, presents a compelling case for organizations looking to leverage the scalability and performance of a cloud-native database. It’s engineered for high throughput and durability, offering features like cross-region replication, continuous backup to Amazon S3, and in-place scaling. For businesses that prioritize availability and performance, Aurora can be a game-changer, especially when considering its compatibility with MySQL and PostgreSQL, which allows for easy migration of existing applications.

However, the decision to adopt Aurora must be made with a full understanding of the implications of vendor lock-in. While Aurora’s deep integration with AWS services can significantly enhance performance and scalability, it also means that your database infrastructure is closely tied to AWS. This can affect future migration strategies and may limit flexibility in how you manage and interact with your database.

For DevOps teams, the adoption of Aurora should align with a broader cloud strategy that values rapid scalability, high availability, and managed services. If your organization’s direction is to fully embrace AWS’s ecosystem to leverage its advanced features and integrations, then Aurora represents a strategic investment. It’s about balancing the trade-offs between operational efficiency, performance benefits, and the commitment to a specific cloud provider.

In summary, while Aurora may present a form of vendor lock-in, its adoption can be justified by its performance, scalability, and the ability to reduce operational overhead—key factors that are often at the forefront of strategic decision-making in cloud architecture and DevOps practices.

Final Thoughts: Elevating Database Management

As we stand on the cusp of a new horizon in cloud computing, Amazon DevOps Guru for RDS emerges not just as a tool, but as a paradigm shift in how we approach database management. It represents a significant leap from reactive troubleshooting to a more enlightened model of proactive and predictive database care.

In the dynamic landscape of e-commerce, where every second of downtime can equate to lost opportunities, the ability to preemptively identify and rectify database issues is invaluable. DevOps Guru for RDS embodies this preemptive philosophy, offering a suite of insights that are not merely data points, but actionable intelligence that can guide strategic decisions.

The integration of machine learning and automated tuning recommendations brings a level of sophistication to database administration that was previously unattainable. This technology does not replace the human element but enhances it, allowing DevOps professionals to not just solve problems, but to innovate and optimize continuously.

Moreover, the conversation about database management is incomplete without addressing the strategic implications of choosing a service like Amazon Aurora. While it may present a closer tie to the AWS ecosystem, it also offers unparalleled performance benefits that can be the deciding factor for businesses prioritizing efficiency and growth.

As we embrace these advanced tools and services, we must also adapt our mindset. The future of database management is one where agility, foresight, and an unwavering commitment to performance are the cornerstones. Amazon DevOps Guru for RDS is more than just a service; it’s a testament to AWS’s understanding of the needs of modern businesses and their DevOps teams. It’s a step towards a future where database issues are no longer roadblocks but stepping stones to greater reliability and excellence in our digital services.

In embracing Amazon DevOps Guru for RDS, we’re not just keeping pace with technology; we’re redefining the benchmarks for database performance and management. The journey toward a more resilient, efficient, and proactive database environment begins here, and the possibilities are as expansive as the cloud itself.

Are You Using “kubectl auth can-i”?. The Underutilized Command You Need to Know

In the Kubernetes realm, ensuring the security and proper assignment of roles and permissions within a cluster is paramount. Kubernetes administrators often face the challenge of verifying whether a particular user or service account has the necessary permissions to act. This is where the often underutilized ‘kubectl auth can-i’ command comes into play, offering a straightforward way to check access rights without executing the actual operation.

The Power of ‘kubectl auth can-i’: 

The ‘kubectl auth can-i’ command is a part of the Kubernetes command-line tool that allows you to query the Kubernetes RBAC (Role-Based Access Control) to check if a user, group, or service account can perform a specific action. It’s an invaluable command for DevOps engineers and Kubernetes administrators to verify and troubleshoot permissions.

Basic Usage: To use ‘kubectl auth can-i’, you simply follow the syntax:

kubectl auth can-i <verb> <resource>

For example, if you want to check if your current user can create deployments in the default namespace, you would use:

kubectl auth can-i create deployments

Checking Permissions for a Service Account: 

Let’s say you have a service account named ‘monitoring-sa’ in the ‘monitoring’ namespace, and you want to check if it has permission to list endpoints (which is crucial for service discovery in monitoring solutions). You could run:

kubectl auth can-i list endpoints --namespace monitoring --as system:serviceaccount:monitoring:monitoring-sa

This command will return ‘yes’ if the service account has the required permissions, or ‘no’ if it does not.

Advanced Examples: 

You can also use ‘kubectl auth can-i’ to check permissions for verbs that are not part of the standard Kubernetes API. For instance, if you’re using Custom Resource Definitions (CRDs), you can check permissions for these as well:

kubectl auth can-i create mycustomresources.mydomain.com --as system:serviceaccount:monitoring:monitoring-sa

Besides checking permissions for standard Kubernetes API actions and Custom Resource Definitions (CRDs), ‘kubectl auth can-i’ can be used to verify permissions for specific API subresources. Subresources like ‘status’ and ‘scale’ are important for certain operations and can have separate permissions from the main resource.

For instance, if you want to check if a service account has the permission to update the status of a deployment, which is a common requirement for continuous deployment setups, you could use:

kubectl auth can-i update deployments/status --namespace production --as system:serviceaccount:default:deploy-sa

This command will check if the ‘deploy-sa’ service account in the ‘default’ namespace has permission to update the status subresource of deployments in the production namespace.

Another advanced use case is checking permissions for pod exec, which is crucial for debugging:

kubectl auth can-i create pod/exec --namespace development --as system:serviceaccount:default:debug-sa

This will verify if the ‘debug-sa’ service account in the ‘default’ namespace is allowed to execute commands in pods within the ‘development’ namespace. This is particularly useful when setting up service accounts for CI/CD pipelines that need to perform diagnostic commands in running pods.

By providing multiple advanced examples, we can demonstrate the versatility of the ‘kubectl auth can-i’ command in managing complex permission scenarios in Kubernetes.

Looking Ahead: 

The ‘kubectl auth can-i’ command is a simple yet powerful tool to help manage and verify permissions within a Kubernetes cluster. It’s an essential command for anyone responsible for the security and integrity of their Kubernetes environment.

Remember, always verify before you deploy!

Basics: Kubernetes ConfigMaps and Secrets

Kubernetes offers robust tools for managing application configurations and safeguarding sensitive data: ConfigMaps and Secrets. This article provides hands-on examples to help you grasp these concepts.

What are ConfigMaps?

ConfigMaps in Kubernetes are designed to manage non-sensitive configuration data. They are generally created using YAML files that specify the configuration parameters.

Example: Environment Variables

Consider an application that requires a database URL and an API key. You can use a ConfigMap to set these as environment variables. Here’s a sample YAML file:

apiVersion: v1
kind: ConfigMap
metadata:
  name: app-config
data:
  DB_URL: jdbc:mysql://localhost:3306/db
  API_KEY: key123

Mounting ConfigMaps as Volumes

ConfigMaps can also be mounted as volumes, making them accessible to pods as files. This is useful for configuration files or scripts.

Example: Mount as Volume

To mount a ConfigMap as a volume, you can modify the pod specification like this:

apiVersion: v1
kind: Pod
metadata:
  name: my-pod
spec:
  containers:
  - name: my-container
    image: my-image
    volumeMounts:
    - name: config-volume
      mountPath: /etc/config
  volumes:
  - name: config-volume
    configMap:
      name: app-config

What are Secrets?

Secrets are used for storing sensitive information like passwords and API tokens securely. It’s important to note that the data in Secrets should be encoded in base64 for an added layer of security.

Example: Secure API Token

To store an API token securely, you can create a Secret like this:

apiVersion: v1
kind: Secret
metadata:
  name: api-secret
data:
  API_TOKEN: base64_encoded_token

To generate a base64-encoded token, you can use the following command:

echo -n 'your_actual_token' | base64

In Summary

ConfigMaps and Secrets are indispensable tools in Kubernetes for managing configuration data and sensitive information. Understanding how to use them effectively is crucial for any Kubernetes deployment.

Understanding the Differences: kubectl exec vs kubectl attach

Kubernetes has become a cornerstone in the container orchestration world, and being adept at maneuvering through the Kubernetes environment is crucial for DevOps professionals.

Among the various tools at our disposal, kubectl stands out as an essential command-line tool for interacting with clusters.

kubectl exec

The kubectl exec command is utilized to run commands in a specific container within a Pod.

When you execute kubectl exec, it creates a new terminal session inside the container which allows for both interactive and non-interactive command execution.

Example: Suppose you have a running Pod hosting a web service and you wish to check the contents of a specific directory. You could use kubectl exec to run the ls command in the container, listing the files in that directory.

kubectl attach

On the other hand, kubectl attach allows you to attach to a running process within a container.

Unlike kubectl exec, kubectl attach connects to an existing terminal session, allowing you to observe the standard output and error of the running process.

Example: If you have a Pod running an application that writes logs to standard output, you could use kubectl attach to view these logs in real time.

Summarizing:

While kubectl exec spawns a new terminal session, kubectl attach connects to an existing session.

kubectl exec is more versatile for executing arbitrary commands, whereas kubectl attach is useful for interacting with running processes and observing their real-time behavior.

The key takeaway is understanding when to use kubectl exec versus kubectl attach based on the task at hand.

Basic Understanding of a Load Balancer

🔹 Load Balancing Definition:
Load balancing is a mechanism where the incoming internet traffic to a website is efficiently distributed across multiple servers in a server pool. This helps ensure that no individual server gets overburdened, ensuring swift server response time and high throughput.

🔹 Various Load Balancing Methods:
There are several methods of load balancing, all based on specific algorithms. Notable methods include:

  • Round-Robin Method
    • Description: Distributes requests evenly and sequentially among all available servers in the group. Each server gets a request in turn.
    • Typical Use: Good for scenarios where all servers have similar resources and tasks are more or less uniform in terms of resource consumption.
  • IP Hash Method
    • Description: Uses the client’s IP address to determine the server to which the request will be sent. A hash is generated from the client’s IP and is used to assign the request to a server.
    • Typical Use: Useful for ensuring that a particular client always connects to the same server, beneficial for maintaining user state consistency.
  • Least Connection Method
    • Description: Directs new requests to the server with the fewest active connections at that moment.
    • Typical Use: Useful when sessions have variable durations and you want to prevent any server from becoming overwhelmed.
  • Least Response Time Method
    • Description: Selects the server with the least response time to handle a new request. Both connection time and the number of active connections are considered.
    • Typical Use: Ideal for scenarios where latency and speed are critical, such as in real-time applications.
  • Least Bandwidth Method
    • Description: Assigns the new request to the server that is using the least amount of bandwidth at that moment.
    • Typical Use: Useful in environments where bandwidth is a limited resource and you want to optimize its use.

🔹 Load Balancer Appearance:
Load balancers can exist in three forms: Hardware Load Balancers, which are costly but can handle high-volume traffic; Software Load Balancers, which are budget-friendly but flexible; and Virtual Load Balancers, which emulate a hardware load balancer in a virtual machine environment.

🔹 Benefit of Load Balancing:
The purpose of a load balancer is to avoid overworking a single server and causing downtime, thereby making sure users get timely responses from the website.

🔹 Necessity for Websites:
With thousands of different clients accessing a website per minute, load balancing is essential to ensure every request and information flow operates optimally.

Understanding Kubernetes: CRDs, Resource Definitions, and Operators


Kubernetes has made a significant impact as a container orchestration tool, but it’s crucial to understand that its utility doesn’t end there. One of its most compelling features is the ability to extend its API with Custom Resource Definitions (CRDs), especially since Kubernetes version 1.7. This article delves into what CRDs are, why they are essential, and how they work in conjunction with controllers to simplify complex tasks within a Kubernetes cluster.

.- What are Custom Resource Definitions (CRDs)?

CRDs act as extensions of the Kubernetes API, allowing users to create new types of resources without adding another API server. Simply put, CRDs serve as vehicles to extend the Kubernetes ecosystem. They are vital for enriching Kubernetes functionalities beyond its basic scope.

.- Basic Kubernetes Functionality Without CRDs

In an out-of-the-box Kubernetes setup, users can define deployments that spawn replica sets, which in turn create pods for running containers. Users can also set up services and ingress controllers for network access to these containers. However, this native functionality has limitations, such as lacking an in-built storage solution.

.- The Need for Extending Kubernetes

The real power of Kubernetes lies in its extensibility. Almost every third-party tool or service designed for Kubernetes operates through CRDs, which extend your cluster’s functionalities. For instance, if you are implementing a service mesh like Istio, it will extend your cluster with several CRDs like VirtualServices and Gateways.

.- The Role of Controllers in CRDs

CRDs by themselves are not functional. When a custom resource is created, the Kubernetes API only signals an event stating that a resource is created. Controllers respond to these events. They watch for specific changes to custom resources and take action accordingly, thereby breathing life into CRDs.

.- Benefits of Using CRDs and Controllers

The duo of CRDs and controllers can significantly simplify many tasks. They move the heavy lifting from the client-side to the server-side, reducing complexity and eliminating the need for client-side templating solutions. As a result, end-users can define their applications in a more Kubernetes-native way, without diving into the lower-level details.

Example: Creating a Simple CRD:

apiVersion: apiextensions.k8s.io/v1
kind: CustomResourceDefinition
metadata:
  name: myresources.mycompany.com
spec:
  group: mycompany.com
  versions:
    - name: v1
      served: true
      storage: true
      schema:
        openAPIV3Schema:
          type: object
          properties:
            spec:
              type: object
              properties:
                key:
                  type: string

.- Understanding Kubernetes Operators

After we’ve laid down the groundwork by discussing CRDs and controllers, it’s essential to touch upon Kubernetes Operators, which bring the two together in a well-organized manner. In essence, an Operator is a method of packaging, deploying, and managing a Kubernetes application.

An Operator extends Kubernetes to automate the management of the entire lifecycle of a particular application, API, or resource. It builds upon the basic Kubernetes resource and controller concepts but includes domain or application-specific knowledge to automate common tasks. For example, an Operator could manage a database cluster, handling tasks such as backups, updates, and scaling.

.- Using an Operator to Manage a Database Cluster

Imagine you have a PostgreSQL database running within your Kubernetes cluster. You could deploy a PostgreSQL Operator that automatically handles routine tasks like backups, updates, or even scaling. This Operator would use CRDs to understand custom resources that define the desired state for these tasks and use a controller to ensure the current state matches the desired state.

Here is a simplified YAML example defining a PostgresCluster custom resource, which could be managed by a PostgreSQL Operator:

Example: Using an Operator to Manage a Database Cluster

apiVersion: postgresql.org/v1
kind: PostgresCluster
metadata:
  name: my-postgres-cluster
spec:
  replicas: 3
  version: "12"
  backup:
    enabled: true
    schedule: "0 0 * * *"

.- Recommendations and Best Practices

While CRDs and controllers offer immense utility, it’s critical to rely on established practices and tools when implementing them. Do not attempt to write your controllers manually unless you are very experienced; instead, rely on tools like Operator SDK for creating operators for your CRDs.

.- Wrapping Up

We’ve explored the powerful features Kubernetes provides beyond its basic functionalities. Custom Resource Definitions (CRDs) allow us to extend the Kubernetes API, enabling more tailored operations within our cluster. Controllers breathe life into these CRDs by reacting to events and ensuring that the state of our resources aligns with our specifications.

Moreover, we touched upon Kubernetes Operators, which encapsulate both CRDs and controllers, along with domain-specific logic, to manage complex applications effortlessly. Operators serve as the cherry on top in the Kubernetes extensibility model, automating routine tasks and simplifying cluster management even further.

By embracing CRDs, controllers, and operators, we can exploit Kubernetes’ full potential and create an environment that’s not only flexible but also significantly easier to manage. As Kubernetes continues to evolve, leveraging these elements will undoubtedly make our journey in the cloud-native world much smoother.

Decoding Kubernetes: When HPA Can’t Fetch Metrics

The Horizontal Pod Autoscaler (HPA) is pivotal in Kubernetes. It’s like our trusty assistant, automatically adjusting the number of pods in a deployment according to observed metrics like CPU usage. However, there are moments when it encounters hurdles. One such instance is when you stumble upon error messages such as:

Name:                                                  widget-app-sun
Namespace:                                             development
...
Metrics:                                               ( current / target )
  resource cpu on pods  (as a percentage of request):  <unknown> / 55%
Min replicas:                                          1
Max replicas:                                          3
Deployment pods:                                       1 current / 0 desired
Conditions:
  Type           Status  Reason                   Message
  ----           ------  ------                   -------
  AbleToScale    True    SucceededGetScale        the HPA controller was able to get the target's current scale
  ScalingActive  False   FailedGetResourceMetric  the HPA was unable to compute the replica count: unable to get metrics for resource cpu: no metrics returned from resource metrics API
Events:
  Type     Reason                        Age                 From                       Message
  ----     ------                        ----                ----                       -------
  Warning  FailedComputeMetricsReplicas  20m (x20 over 9m)   horizontal-pod-autoscaler  invalid metrics (1 invalid out of 1), first error is: failed to get cpu utilization: unable to get metrics for resource cpu: no metrics returned from resource metrics API
  Warning  FailedGetResourceMetric       12s (x29 over 9m)   horizontal-pod-autoscaler  unable to get metrics for resource cpu: no metrics returned from resource metrics API

What’s the Scoop?

This cryptic message is essentially HPA’s way of saying, “I’m having a hard time fetching those CPU metrics I need.” But why? Here are a few culprits:

Perhaps Metrics-server isn’t installed or isn’t operating correctly.
Maybe Metrics-server is present, but it’s struggling to fetch metrics from the nodes.
It could be a misconfiguration on HPA’s end.
Sometimes, network policies or RBAC restrictions come into play, obstructing access to the metrics API.

The Detective Work: Troubleshooting Steps

.- Is Metrics-server Onboard?

kubectl get deployments -n kube-system | grep metrics-server

metrics-server           1/1     1            1           221d

If it’s missing in action, it’s time to deploy it. Helm is a handy tool for this. https://artifacthub.io/packages/helm/metrics-server/metrics-server

.- How’s Metrics-server Feeling Today?

kubectl get pods -n kube-system -l k8s-app=metrics-server

NAME                              READY   STATUS    RESTARTS      AGE
metrics-server-5f9f776df5-zlg42   1/1     Running   6 (71d ago)   221d

Make sure it’s running smoothly. If it’s throwing a tantrum, dive into its logs:

kubectl logs metrics-server-5f9f776df5-zlg42 -n kube-system

I0730 17:07:50.422754       1 secure_serving.go:266] Serving securely on [::]:10250
I0730 17:07:50.425140       1 requestheader_controller.go:169] Starting RequestHeaderAuthRequestController
I0730 17:07:50.425155       1 shared_informer.go:240] Waiting for caches to sync for RequestHeaderAuthRequestController

.- A Peek into Metrics-server’s Config

Sometimes, it needs some flags to communicate correctly, especially if your cluster has a unique CNI or is lounging on a special cloud provider. You might need to check and adjust flags like:

--kubelet-preferred-address-types or --kubelet-insecure-tls

.- The Network or RBAC Culprits

Are there any stringent network policies that are hindering the conversation between the metrics-server and the API server or the kubelets? Or maybe, metrics-server doesn’t have the right RBAC permissions to access metrics?

Peek into network policies in the kube-system namespace:

kubectl get networkpolicy -n kube-system

And don’t forget to inspect the ClusterRole:

kubectl describe clusterrole | grep metrics-server -A10

Name:         system:metrics-server
Labels:       objectset.rio.cattle.io/hash=9a6f488150c249811b9df07e116280789628963e
Annotations:  objectset.rio.cattle.io/applied:
                H4sIAAAAAAAA/4yRwY6bMBCGX6WasyEhSQkg9VD10ENvPfRScRjsSXABG80Yom7Eu69MotVKq93syRr/+j7711wBR/uHWKx3UAE3qFOcQuvZPmGw3qVdIan1mzkDBZ11Bir40U8SiH...

.- Version Harmony: HPA & Metrics-server

Compatibility matters! Ensure HPA and metrics-server are on the same page. Sometimes, a version mismatch might be the root cause.

Here’s how to check your Kubernetes version:

kubectl version

Client Version: v1.28.2
Kustomize Version: v5.0.4-0.20230601165947-6ce0bf390ce3

And let’s not forget about the metrics-server:

kubectl describe deployment metrics-server -n kube-system | grep Image:

Image:      rancher/mirrored-metrics-server:v0.6.2

Troubleshooting in Kubernetes can be challenging, but with a systematic approach, many issues, like the HPA metrics problem, can be resolved. It’s essential to understand the components involved and to remain adaptable. As Kubernetes continues to evolve, so too should our methods for diagnosing and fixing problems.

How to Survive Being a DevOps

In the ever-evolving landscape of technology, the role of DevOps has rapidly carved its indispensable niche. As experts bridging the chasm between development (Dev) and operations (Ops), DevOps professionals ensure that software is not just developed right, but also deployed right. Yet, I’m acutely aware of the current friction and debates regarding the longevity of the DevOps role, especially with emerging discussions about whether it will be overshadowed or even replaced by Platform Engineers. Regardless of these debates, the DevOps profession comes with its unique set of challenges. Here are some survival tips for thriving as a DevOps engineer:

  • Embrace Continuous Learning:
    The tech world never stands still, and neither should you. Tools, platforms, and methodologies keep evolving. Stay updated with the latest in the field, attend webinars, workshops, and conferences.
  • Automate Everything:
    The mantra of DevOps is automation. From continuous integration, continuous delivery (CI/CD) pipelines to infrastructure as code (IAC), the more you automate, the smoother your workflows will be.
  • Cultivate Soft Skills:
    DevOps isn’t just about technical knowledge. Communication, empathy, and collaboration skills are equally crucial. Often, you’ll be the bridge between teams with differing objectives; soft skills will be invaluable.
  • Prioritize Work-Life Balance:
    Burnout is a genuine concern in a role that can be 24/7 due to deployment schedules and uptime requirements. It’s essential to set boundaries, take breaks, and remember self-care.
  • Understand the Business:
    To offer the best solutions, you need to understand the business requirements and goals. This will not only make you more effective but also showcase your value to the organization.
  • Establish Clear Communication Channels:
    Since DevOps professionals often work at the intersection of various teams, establishing clear communication channels helps in reducing friction and miscommunication.
  • Celebrate Small Wins:
    In a fast-paced environment, it’s easy to move from one task to another without recognizing achievements. Celebrating small wins helps keep motivation high and fosters a positive team environment.
  • Seek Feedback and Continuously Improve:
    Constructive criticism is a tool for growth. Regularly seek feedback on your work, and be willing to iterate and improve upon your processes.
  • Stay Security Conscious:
    With the rise of cyber threats, a DevOps professional must always be security-minded. Ensure that security best practices are ingrained in every step of the development and deployment process.
  • Build a Supportive Network:
    Connect with fellow DevOps professionals. Having a support system can be an invaluable resource for sharing knowledge, best practices, and even venting about common challenges.

    Mastering the role of a DevOps hinges on a balance of technical acumen, soft skills, and a proactive approach to one’s well-being. With the right strategies and mindset, I’m sure that WE can handle the challenges of this role with resilience and success.