ITInfrastructure

Deciphering AWS Network Mysteries with Reachability Analyzer

Let’s talk about the cloud, specifically, the tangled web of networks we build inside AWS. You spin up your Virtual Private Clouds (VPCs), toss in some subnets, sprinkle in a few security groups, configure those route tables, and before you know it, you’ve got a more complex network than a Rube Goldberg machine. Everything works great… until it doesn’t. A connection fails, an application times out, and you’re left scratching your head. Where do you even begin to troubleshoot?

This is the exact headache that AWS Reachability Analyzer is designed to cure. It is not the most known tool in the AWS toolbox, but believe me, it’s a lifesaver when diagnosing network connectivity issues. This article will explore what Reachability Analyzer is, how this handy tool works its magic, and why you should use it to keep your AWS network humming along smoothly.

What exactly is AWS Reachability Analyzer?

So, what’s the deal with Reachability Analyzer? Think of it as your network detective. It’s a configuration analysis tool that lets you test the connectivity between a source and a destination within your AWS environment. The beauty of it is that it doesn’t send any live traffic. Instead, it does something much smarter.

This nifty tool analyzes your network configuration, your security groups, Network Access Control Lists (NACLs), route tables, and all that jazz. It then builds a virtual model of your network and simulates the path that traffic would take. This way it determines whether packets starting their journey at the source could reach their intended destination.

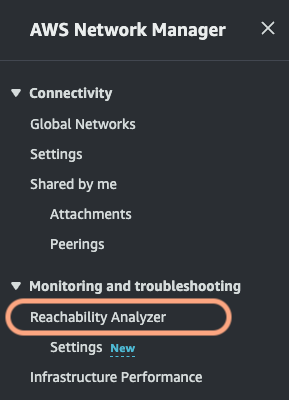
Reachability Analyzer is part of the VPC service but tightly integrates with AWS Network Manager. If you’re dealing with a global network spanning multiple regions, Network Manager lets you run these reachability analyses centrally, giving you a bird’s-eye view of connectivity across your entire infrastructure.

It’s essential to understand what Reachability Analyzer doesn’t do. It won’t test your application-level connectivity or tell you anything about latency. It strictly focuses on the network layer, making sure the path is clear, based on your setup. It also does not take into account firewall rules of the OS, or the capacity of the resources to handle the traffic.

The perks of using Reachability Analyzer

Why bother with Reachability Analyzer? Let me break down the key benefits:

  • Pinpoint Connectivity Problems Fast: No more endless digging through logs or running manual traceroutes. Reachability Analyzer quickly identifies the root cause of connectivity issues, saving you precious time and frustration.
  • Validate Your Network Setup: It helps ensure your network is configured exactly as you intended and that your security policies are correctly enforced.
  • Plan Network Changes with Confidence: Before making any changes to your network, you can use Reachability Analyzer to simulate the impact and avoid accidental outages.
  • Boost Your Security Posture: By uncovering potential configuration flaws, it helps you strengthen your network’s defenses.
  • Easy Peasy to Use: The interface is intuitive. You don’t need to be a networking guru to use it effectively.
  • Identify Components Involved: It shows you hop-by-hop the details of the virtual path between the origin and the destination, giving you visibility of the resources involved in the connection.

Reachability Analyzer in Action

Let’s get our hands dirty with some practical examples to see how Reachability Analyzer shines in real-world scenarios:

  • Scenario 1 – EC2 Instance Can’t Talk to RDS Database

    Your application running on an EC2 instance is throwing a tantrum and can’t connect to your RDS database, even though they’re in the same VPC. Reachability Analyzer to the rescue! You set up an analysis between the EC2 instance’s Elastic Network Interface (ENI) and the RDS instance’s ENI.

    Bam! Reachability Analyzer might reveal that the RDS security group is the culprit. It’s not allowing inbound traffic from the EC2 instance’s security group on the database port. The problem is identified, and you can fix the security group rule with surgical precision.
  • Scenario 2 – Testing Connectivity After Route Table Tweaks

    You’ve just modified a route table to direct traffic between two subnets through a firewall. Now you need to be sure that connectivity is still working as expected.

    Simply create an analysis between an instance in the source subnet and one in the destination subnet. Reachability Analyzer will show you the complete path, including the hop through the firewall. If there’s a hiccup in the route table or the firewall configuration, you’ll spot it immediately.
  • Scenario 3 – VPN Connectivity Woes

    You’ve set up a VPN connection between your VPC and your on-premise network, but your users are complaining that they can’t access resources on-premise. Time to bring in Reachability Analyzer.

    Run an analysis from an instance in your VPC to an IP address of a server in your on-premise network. Reachability Analyzer might show you that your subnet’s route table is missing a route to the on-premise network via the Virtual Private Gateway (VGW). Or maybe there is a problem with the configuration of your VPN tunnel. The results will give you the clues you need to troubleshoot the VPN setup.
  • Scenario 4 – Transit Gateway Validation

    You are using a Transit Gateway to connect multiple VPCs, and you need to verify connectivity between them.

    Configure tests between instances in different VPCs attached to the Transit Gateway. Reachability Analyzer will show you if the Transit Gateway route tables are correctly configured and if the VPCs can communicate through the resource. It can also help determine if there are asymmetric routing issues, where traffic flows in one direction but not the other.

How to use Reachability Analyzer

Ready to give it a spin? Here’s a simple step-by-step guide:

  1. Access the Tool: Head over to the AWS Management Console, navigate to the VPC section, and you’ll find Reachability Analyzer there. Or, if you are using Network Manager, you can find it in that section.
  2. Create an Analysis:

.- Select your source and destination. This could be an EC2 instance, an ENI, an Internet Gateway, a VPN Gateway, and more.

.- Specify the protocol (TCP or UDP) and optionally, the destination port.

.- If needed and applicable, enter the source IP address or port.

  1. Run the Analysis: Hit the “Create and run analysis path” button and let Reachability Analyzer do its thing.
  2. Interpret the Results:

.- The tool will tell you if the destination is “Reachable” or “Not reachable.”

.- If there’s a problem, it will provide a detailed breakdown of the path, showing you exactly which component is blocking the connection and an explanation of why.

  1. Run the Analysis from Network Manager: If you have a global network, run the reachability analysis from Network Manager for a broader view.

Wrapping Up

AWS Reachability Analyzer is a powerful tool that simplifies network troubleshooting and gives you greater control over your AWS environment. It’s like having X-ray vision for your network. So, next time you encounter a connectivity mystery in your AWS setup, don’t panic. Fire up Reachability Analyzer, and you will have answers in minutes. Try it out, experiment, and unlock the secrets of your network.

How to check if a folder is used by services on Linux

You know that feeling when you’re spring cleaning your Linux system and spot that mysterious folder lurking around forever? Your finger hovers over the delete key, but something makes you pause. Smart move! Before removing any folder, wouldn’t it be nice to know if any services are actively using it? It’s like checking if someone’s sitting in a chair before moving it. Today, I’ll show you how to do that, and I promise to keep it simple and fun.

Why should you care?

You see, in the world of DevOps and SysOps, understanding which services are using your folders is becoming increasingly important. It’s like being a detective in your own system – you need to know what’s happening behind the scenes to avoid accidentally breaking things. Think of it as checking if the room is empty before turning off the lights!

Meet your two best friends lsof and fuser

Let me introduce you to two powerful tools that will help you become this system detective: lsof and fuser. They’re like X-ray glasses for your Linux system, letting you see invisible connections between processes and files.

The lsof command as your first tool

lsof stands for “list open files” (pretty straightforward, right?). Here’s how you can use it:

lsof +D /path/to/your/folder

This command is like asking, “Hey, who’s using stuff in this folder?” The system will then show you a list of all processes that are accessing files in that directory. It’s that simple!

Let’s break down what you’ll see:

  • COMMAND: The name of the program using the folder
  • PID: A unique number identifying the process (like its ID card)
  • USER: Who’s running the process
  • FD: File descriptor (don’t worry too much about this one)
  • TYPE: Type of file
  • DEVICE: Device numbers
  • SIZE/OFF: Size of the file
  • NODE: Inode number (system’s way of tracking files)
  • NAME: Path to the file

The fuser command as your second tool

Now, let’s meet fuser. It’s like lsof’s cousin, but with a different approach:

fuser -v /path/to/your/folder

This command shows you which processes are using the folder but in a more concise way. It’s perfect when you want a quick overview without too many details.

Examples

Let’s say you have a folder called /var/www/html and you want to check if your web server is using it:

lsof +D /var/www/html

You might see something like:

COMMAND  PID     USER   FD   TYPE DEVICE SIZE/OFF NODE NAME
apache2  1234    www-data  3r  REG  252,0   12345 67890 /var/www/html/index.html

This tells you that Apache is reading files from that folder, good to know before making any changes!

Pro tips and best practices

  • Always check before deleting When in doubt, it’s better to check twice than to break something once. It’s like looking both ways before crossing the street!
  • Watch out for performance The lsof +D command checks all subfolders too, which can be slow for large directories. For quicker checks of just the folder itself, you can use:
lsof +d /path/to/folder
  • Combine commands for better insights You can pipe these commands with grep for more specific searches:
lsof +D /path/to/folder | grep service_name

Troubleshooting common scenarios

Sometimes you might run these commands and get no output. Don’t panic! This usually means no processes are currently using the folder. However, remember that:

  • Some processes might open and close files quickly
  • You might need sudo privileges to see everything
  • System processes might be using files in ways that aren’t immediately visible

Conclusion

Understanding which services are using your folders is crucial in modern DevOps and SysOps environments. With lsof and fuser, you have powerful tools at your disposal to make informed decisions about your system’s folders.

Remember, the key is to always check before making changes. It’s better to spend a minute checking than an hour fixing it! These tools are your friends in maintaining a healthy and stable Linux system.

Quick reference

# Check folder usage with lsof
lsof +D /path/to/folder

# Quick check with fuser
fuser -v /path/to/folder

# Check specific service
lsof +D /path/to/folder | grep service_name

# Check folder without recursion
lsof +d /path/to/folder

The commands we’ve explored today are just the beginning of your journey into better Linux system management. As you become more comfortable with these tools, you’ll find yourself naturally integrating them into your daily DevOps and SysOps routines. They’ll become an essential part of your system maintenance toolkit, helping you make informed decisions and prevent those dreaded “Oops, I shouldn’t have deleted that” moments.

Being cautious with system modifications isn’t about being afraid to make changes,  it’s about making changes confidently because you understand what you’re working with. Whether you’re managing a single server or orchestrating a complex cloud infrastructure, these simple yet powerful commands will help you maintain system stability and peace of mind.

Keep exploring, keep learning, and most importantly, keep your Linux systems running smoothly. The more you practice these techniques, the more natural they’ll become. And remember, in the world of system administration, a minute of checking can save hours of troubleshooting!

A Comparative Look at Cloud Engineers and DevOps Engineers

The roles of Cloud Engineers and DevOps Engineers have emerged as pivotal to the success of technology-driven businesses. While the titles might sound similar and are sometimes used interchangeably, each role carries distinct responsibilities, objectives, and skill sets. However, there’s also a significant overlap, creating a synergy that drives efficiency and innovation.

Understanding the Roles

Cloud Engineer: A Cloud Engineer’s primary focus is on the creation and management of cloud infrastructure. This role ensures that the applications developed by a company can seamlessly run on cloud platforms. Cloud Engineers are akin to architects and builders in the digital realm. They must be knowledgeable about various cloud services and understand how to configure them to meet the company’s business needs and requirements. For instance, if a company requires a global presence, a Cloud Engineer will configure the cloud services to ensure efficient and secure distribution across different geographic regions.

DevOps Engineer: The term “DevOps” blends development and operations, aiming to harmonize software development (Dev) with IT operations (Ops). The primary goal of a DevOps Engineer is to shorten the development lifecycle, fostering a culture and environment where building, testing, and releasing software can happen rapidly, frequently, and more reliably. They focus on automating and streamlining the software release process to ensure fast, efficient, and bug-free deployments.

Differences and Overlaps

While the core objectives differ, Cloud Engineers focus on infrastructure, and DevOps Engineers on the software release process, their paths intertwine in the realm of automation and efficiency. Both roles aim to simplify complexities, albeit in different layers of the IT ecosystem.

Overlap: Both roles share a common ground when it comes to automating tasks to enhance performance and reliability. For instance, both Cloud and DevOps Engineers might utilize Infrastructure as Code (IaC) to automate the setup and management of the infrastructure. This synergy is pivotal in environments where rapid deployment and management of infrastructure are crucial for the business’s success.

Distinctive Responsibilities: Despite the overlaps, each role has its distinct responsibilities. Cloud Engineers are more focused on the cloud infrastructure’s nuts and bolts (ensuring that the setup is secure, reliable, and optimally configured). On the other hand, DevOps Engineers are more aligned with the development side, ensuring that the software release pipeline is as efficient as possible.

Toolkits and Discussion Points: DevOps Engineers vs. Cloud Architects

Both, DevOps Engineers and Cloud Architects arm themselves with an array of tools and frameworks, each tailored to their unique responsibilities.

DevOps Engineer: The Automation Maestro

Tools and Frameworks:

  • IDEs and Code Editors: DevOps Engineers frequently use powerful IDEs like Visual Studio Code or JetBrains IntelliJ for scripting and automation. These IDEs support a multitude of languages and plugins, catering to the versatile nature of DevOps work.
  • Automation and CI/CD Tools: Jenkins, Travis CI, GitLab CI, and CircleCI are staples for automating the software build, test, and deployment processes, ensuring a smooth and continuous integration/continuous deployment (CI/CD) pipeline.
  • Infrastructure as Code (IaC) Tools: Tools like Terraform and AWS CloudFormation allow DevOps Engineers to manage infrastructure using code, making the process more efficient, consistent, and error-free.
  • Configuration Management Tools: Ansible, Puppet, and Chef help in automating the configuration of servers, ensuring that the systems are in a desired, predictable state.
  • Containerization and Orchestration Tools: Docker and Kubernetes dominate the container ecosystem, allowing for efficient creation, deployment, and scaling of applications across various environments.

Meeting Discussions: In team meetings, DevOps Engineers often discuss topics such as optimizing the CI/CD pipeline, ensuring high availability and scalability of services, automating repetitive tasks, and maintaining security throughout the software development lifecycle. The focus is on streamlining processes, enhancing the quality of releases, and minimizing downtime.

Cloud Architect: The Digital Strategist

Tools and Frameworks:

  • Cloud Service Providers’ Consoles and CLI Tools: AWS Management Console, Azure Portal, and Google Cloud Console, along with their respective CLI tools, are indispensable for managing and interacting with cloud resources.
  • Diagram and Design Tools: Tools like Lucidchart and Draw.io are frequently used for designing and visualizing the architecture of cloud solutions, helping in clear communication and planning.
  • Monitoring and Management Tools: Cloud Architects rely on tools like AWS CloudWatch, Google Operations (formerly Stackdriver), and Azure Monitor to keep a vigilant eye on the performance and health of cloud infrastructure.
  • Security and Compliance Tools: Ensuring that the architecture adheres to security standards and compliance requirements is crucial, making tools like AWS Config, Azure Security Center, and Google Security Command Center key components of a Cloud Architect’s toolkit.

Meeting Discussions: Cloud Architects’ meetings revolve around designing robust, scalable, and secure cloud solutions. Discussions often involve evaluating different architectural approaches, ensuring alignment with business goals, complying with security and regulatory standards, and planning for scalability and disaster recovery.

Harmonizing Tools and Talents

While the tools and discussion points highlight the distinctions between DevOps Engineers and Cloud Architects, it’s the harmonious interaction between these roles that empowers organizations to thrive in the digital era. DevOps Engineers’ focus on automation and process optimization complements Cloud Architects’ strategic approach to cloud infrastructure, together driving innovation, efficiency, and resilience.

The Big Picture

The roles of Cloud Engineers and DevOps Engineers are not isolated but rather parts of a larger ecosystem aimed at delivering value through technology. While a Cloud Engineer ensures that the infrastructure is robust and poised for scalability and security, a DevOps Engineer ensures that the software lifecycle—from coding to deployment—is streamlined and efficient.

In an ideal world, these roles should not be siloed but should work in tandem. A robust cloud infrastructure is of little use if the software deployment process is sluggish, and vice versa. Hence, understanding the nuances, differences, and overlaps of these roles is not just academic but pivotal for businesses aiming to leverage technology for growth and innovation.

As technology continues to evolve, the lines between different IT roles might blur, but the essence will remain the same—delivering value through efficient, secure, and innovative technological solutions. Whether you are a Cloud Engineer ensuring the reliability and security of the cloud infrastructure or a DevOps Engineer automating the pipeline for a smoother release process, your role is crucial in the grand tapestry of modern IT operations.