I have spent the better part of three years wrestling with Google Cloud Platform, and I am still not entirely convinced it wasn’t designed by a group of very clever people who occasionally enjoy a quiet laugh at the rest of us. The thing about GCP, you see, is that it works beautifully right up until the moment it doesn’t. Then it fails with such spectacular and Byzantine complexity that you find yourself questioning not just your career choices but the fundamental nature of causality itself.
My first encounter with Cloud Build was typical of this experience. I had been tasked with setting up a CI/CD pipeline for a microservices architecture, which is the modern equivalent of being told to build a Swiss watch while someone steadily drops marbles on your head. Jenkins had been our previous solution, a venerable old thing that huffed and puffed like a steam locomotive and required more maintenance than a Victorian greenhouse. Cloud Build promised to handle everything serverlessly, which is a word that sounds like it ought to mean something, but in practice simply indicates you won’t know where your code is running and you certainly won’t be able to SSH into it when things go wrong.
The miracle, when it arrived, was decidedly understated. I pushed some poorly written Go code to a repository and watched as Cloud Build sprang into life like a sleeper agent receiving instructions. It ran my tests, built a container, scanned it for vulnerabilities, and pushed it to storage. The whole process took four minutes and cost less than a cup of tea. I sat there in my home office, the triumph slowly dawning, feeling rather like a man who has accidentally trained his cat to make coffee. I had done almost nothing, yet everything had happened. This is the essential GCP magic, and it is deeply unnerving.
The vulnerability scanner is particularly wonderful in that quietly horrifying way. It examines your containers and produces a list of everything that could possibly go wrong, like a pilot’s pre-flight checklist written by a paranoid witchfinder general. On one memorable occasion, it flagged a critical vulnerability in a library I wasn’t even aware we were using. It turned out to be nested seven dependencies deep, like a Russian doll of potential misery. Fixing it required updating something else, which broke something else, which eventually led me to discover that our entire authentication layer was held together by a library last maintained in 2018 by someone who had subsequently moved to a commune in Oregon. The scanner was right, of course. It always is. It is the most anxious and accurate employee you will ever meet.
Google Kubernetes Engine or how I learned to stop worrying and love the cluster
If Cloud Build is the efficient butler, GKE is the robot overlord you find yourself oddly grateful to. My initial experience with Kubernetes was self-managed, which taught me many things, primarily that I do not have the temperament to manage Kubernetes. I spent weeks tuning etcd, debugging network overlays, and developing what I can only describe as a personal relationship with a persistent volume that refused to mount. It was less a technical exercise and more a form of digitally enhanced psychotherapy.
GKE’s Autopilot mode sidesteps all this by simply making the nodes disappear. You do not manage nodes. You do not upgrade nodes. You do not even, strictly speaking, know where the nodes are. They exist in the same conceptual space as socks that vanish from laundry cycles. You request resources, and they materialise, like summoning a very specific and obliging genie. The first time I enabled Autopilot, I felt I was cheating somehow, as if I had been given the answers to an exam I had not revised for.
The real genius is Workload Identity, a feature that allows pods to access Google services without storing secrets. Before this, secret management was a dark art involving base64 encoding and whispered incantations. We kept our API keys in Kubernetes secrets, which is rather like keeping your house keys under the doormat and hoping burglars are too polite to look there. Workload Identity removes all this by using magic, or possibly certificates, which are essentially the same thing in cloud computing. I demonstrated it to our security team, and their reaction was instructive. They smiled, which security people never do, and then they asked me to prove it was actually secure, which took another three days and several diagrams involving stick figures.
Istio integration completes the picture, though calling it integration suggests a gentle handshake when it is more like being embraced by a very enthusiastic octopus. It gives you observability, security, and traffic management at the cost of considerable complexity and a mild feeling that you have lost control of your own architecture. Our first Istio deployment doubled our pod count and introduced latency that made our application feel like it was wading through treacle. Tuning it took weeks and required someone with a master’s degree in distributed systems and the patience of a saint. When it finally worked, it was magnificent. Requests flowed like water, security policies enforced themselves with silent efficiency, and I felt like a man who had tamed a tiger through sheer persistence and a lot of treats.
Cloud Deploy and the gentle art of not breaking everything
Progressive delivery sounds like something a management consultant would propose during a particularly expensive lunch, but Cloud Deploy makes it almost sensible. The service orchestrates rollouts across environments with strategies like canary and blue-green, which are named after birds and colours because naming things is hard, and DevOps engineers have a certain whimsical desperation about them.
My first successful canary deployment felt like performing surgery on a patient who was also the anaesthetist. We routed 5 percent of traffic to the new version and watched our metrics like nervous parents at a school play. When errors spiked, I expected a frantic rollback procedure involving SSH and tarballs. Instead, I clicked a button, and everything reverted in thirty seconds. The old version simply reappeared, fully formed, like a magic trick performed by someone who actually understands magic. I walked around the office for the rest of the day with what my colleagues described as a smug grin, though I prefer to think of it as the justified expression of someone who has witnessed a minor miracle.
The integration with Cloud Build creates a pipeline so smooth it is almost suspicious. Code commits trigger builds, builds trigger deployments, deployments trigger monitoring alerts, and alerts trigger automated rollbacks. It is a closed loop, a perpetual motion machine of software delivery. I once watched this entire chain execute while I was making a sandwich. By the time I had finished my ham and pickle on rye, a critical bug had been introduced, detected, and removed from production without any human intervention. I was simultaneously impressed and vaguely concerned about my own obsolescence.
Artifact Registry where containers go to mature
Storing artifacts used to involve a self-hosted Nexus repository that required weekly sacrifices of disk space and RAM. Artifact Registry is Google’s answer to this, a fully managed service that stores Docker images, Helm charts, and language packages with the solemnity of a wine cellar for code.
The vulnerability scanning here is particularly thorough, examining every layer of your container with the obsessive attention of someone who alphabetises their spice rack. It once flagged a high-severity issue in a base image we had been using for six months. The vulnerability allowed arbitrary code execution, which is the digital equivalent of leaving your front door open with a sign saying “Free laptops inside.” We had to rebuild and redeploy forty services in two days. The scanner, naturally, had known about this all along but had been politely waiting for us to notice.
Geo-replication is another feature that seems obvious until you need it. Our New Zealand team was pulling images from a European registry, which meant every deployment involved sending gigabytes of data halfway around the world. This worked about as well as shouting instructions across a rugby field during a storm. Moving to a regional registry in New Zealand cut our deployment times by half and our egress fees by a third. It also taught me that cloud networking operates on principles that are part physics, part economics, and part black magic.
Cloud Operations Suite or how I learned to love the machine that watches me
Observability in GCP is orchestrated by the Cloud Operations Suite, formerly known as Stackdriver. The rebranding was presumably because Stackdriver sounded too much like a dating app for developers, which is a missed opportunity if you ask me.
The suite unifies logs, metrics, traces, and dashboards into a single interface that is both comprehensive and bewildering. The first time I opened Cloud Monitoring, I was presented with more graphs than a hedge fund’s annual report. CPU, memory, network throughput, disk IOPS, custom metrics, uptime checks, and SLO burn rates. It was beautiful and terrifying, like watching the inner workings of a living organism that you have created but do not fully understand.
Setting up SLOs felt like writing a promise to my future self. “I, a DevOps engineer of sound mind, do hereby commit to maintaining 99.9 percent availability.” The system then watches your service like a particularly judgmental deity and alerts you the moment you transgress. I once received a burn rate alert at 2 AM because a pod had been slightly slow for ten minutes. I lay in bed, staring at my phone, wondering whether to fix it or simply accept that perfection was unattainable and go back to sleep. I fixed it, of course. We always do.
The integration with BigQuery for long-term analysis is where things get properly clever. We export all our logs and run SQL queries to find patterns. This is essentially data archaeology, sifting through digital sediment to understand why something broke three weeks ago. I discovered that our highest error rates always occurred on Tuesdays between 2 and 3 PM. Why? A scheduled job that had been deprecated but never removed, running on a server everyone had forgotten about. Finding it felt like discovering a Roman coin in your garden, exciting but also slightly embarrassing that you hadn’t noticed it before.
Cloud Monitoring and Logging the digital equivalent of a nervous system
Cloud Logging centralises petabytes of data from services that generate logs with the enthusiasm of a teenager documenting their lunch. Querying this data feels like using a search engine that actually works, which is disconcerting when you’re used to grep and prayer.
I once spent an afternoon tracking down a memory leak using Cloud Profiler, a service that shows you exactly where your code is being wasteful with RAM. It highlighted a function that was allocating memory like a government department allocates paper clips, with cheerful abandon and no regard for consequences. The function turned out to be logging entire database responses for debugging purposes, in production, for six months. We had archived more debug data than actual business data. The developer responsible, when confronted, simply shrugged and said it had seemed like a good idea at the time. This is the eternal DevOps tragedy. Everything seems like a good idea at the time.
Uptime checks are another small miracle. We have probes hitting our endpoints from locations around the world, like a global network of extremely polite bouncers constantly asking, “Are you open?” When Mumbai couldn’t reach our service but London could, it led us to discover a regional DNS issue that would have taken days to diagnose otherwise. The probes had saved us, and they had done so without complaining once, which is more than can be said for the on-call engineer who had to explain it to management at 6 AM.
Cloud Functions and Cloud Run, where code goes to hide
Serverless computing in GCP comes in two flavours. Cloud Functions are for small, event-driven scripts, like having a very eager intern who only works when you clap. Cloud Run is for containerised applications that scale to zero, which is an economical way of saying they disappear when nobody needs them and materialise when they do, like an introverted ghost.
I use Cloud Functions for automation tasks that would otherwise require cron jobs on a VM that someone has to maintain. One function resizes GKE clusters based on Cloud Monitoring alerts. When CPU utilisation exceeds 80 percent for five minutes, the function spins up additional nodes. When it drops below 20 percent, it scales down. This is brilliant until you realise you’ve created a feedback loop and the cluster is now oscillating between one node and one hundred nodes every ten minutes. Tuning the thresholds took longer than writing the function, which is the serverless way.
Cloud Run hosts our internal tools, the dashboards, and debug interfaces that developers need but nobody wants to provision infrastructure for. Deploying is gloriously simple. You push a container, it runs. The cold start time is sub-second, which means Google has solved a problem that Lambda users have been complaining about for years, presumably by bargaining with physics itself. I once deployed a debugging tool during an incident response. It was live before the engineer who requested it had finished describing what they needed. Their expression was that of someone who had asked for a coffee and been given a flying saucer.
Terraform and Cloud Deployment Manager arguing with machines about infrastructure
Infrastructure as Code is the principle that you should be able to rebuild your entire environment from a text file, which is lovely in theory and slightly terrifying in practice. Terraform, using the GCP provider, is the de facto standard. It is also a source of endless frustration and occasional joy.
The state file is the heart of the problem. It is a JSON representation of your infrastructure that Terraform keeps in Cloud Storage, and it is the single source of truth until someone deletes it by accident, at which point the truth becomes rather more philosophical. We lock the state during applies, which prevents conflicts but also means that if an apply hangs, everyone is blocked. I have spent afternoons staring at a terminal, watching Terraform ponder the nature of a load balancer, like a stoned philosophy student contemplating a spoon.
Deployment Manager is Google’s native IaC tool, which uses YAML and is therefore slightly less powerful but considerably easier to read. I use it for simple projects where Terraform would be like using a sledgehammer to crack a nut, if the sledgehammer required you to understand graph theory. The two tools coexist uneasily, like cats who tolerate each other for the sake of the humans.
Drift detection is where things get properly philosophical. Terraform tells you when reality has diverged from your code, which happens more often than you’d think. Someone clicks something in the console, a service account is modified, a firewall rule is added for “just a quick test.” The plan output shows these changes like a disappointed teacher marking homework in red pen. You can either apply the correction or accept that your infrastructure has developed a life of its own and is now making decisions independently. Sometimes I let the drift stand, just to see what happens. This is how accidents become features.
IAM and Cloud Asset Inventory, the endless game of who can do what
Identity and Access Management in GCP is both comprehensive and maddening. Every API call is authenticated and authorised, which is excellent for security but means you spend half your life granting permissions to service accounts. A service account, for the uninitiated, is a machine pretending to be a person so it can ask Google for things. They are like employees who never take a holiday but also never buy you a birthday card.
Workload Identity Federation allows these synthetic employees to impersonate each other across clouds, which is identity management crossed with method acting. We use it to let our AWS workloads access GCP resources, a process that feels rather like introducing two friends who are suspicious of each other and speak different languages. When it works, it is seamless. When it fails, the error messages are so cryptic they may as well be in Linear B.
Cloud Asset Inventory catalogs every resource in your organisation, which is invaluable for audits and deeply unsettling when you realise just how many things you’ve created and forgotten about. I once ran a report and discovered seventeen unused load balancers, three buckets full of logs from a project that ended in 2023, and a Cloud SQL instance that had been running for six months with no connections. The bill was modest, but the sense of waste was profound. I felt like a hoarder being confronted with their own clutter.
For European enterprises, the GDPR compliance features are critical. We export audit logs to BigQuery and run queries to prove data residency. The auditors, when they arrived, were suspicious of everything, which is their job. They asked for proof that data never left the europe-west3 region. I showed them VPC Service Controls, which are like digital border guards that shoot packets trying to cross geographical boundaries. They seemed satisfied, though one of them asked me to explain Kubernetes, and I saw his eyes glaze over in the first thirty seconds. Some concepts are simply too abstract for mortal minds.
Eventarc and Cloud Scheduler the nervous system of the cloud
Eventarc routes events from over 100 sources to your serverless functions, creating event-driven architectures that are both elegant and impossible to debug. An event is a notification that something happened, somewhere, and now something else should happen somewhere else. It is causality at a distance, action at a remove.
I have an Eventarc trigger that fires when a vulnerability is found, sending a message to Pub/Sub, which fans out to multiple subscribers. One subscriber posts to Slack, another creates a ticket, and a third quarantines the image. It is a beautiful, asynchronous ballet that I cannot fully trace. When it fails, it fails silently, like a mime having a heart attack. The dead-letter queue catches the casualties, which I check weekly like a coroner reviewing unexplained deaths.
Cloud Scheduler handles cron jobs, which are the digital equivalent of remembering to take the bins out. We have schedules that scale down non-production environments at night, saving money and carbon. I once set the timezone incorrectly and scaled down the production cluster at midday. The outage lasted three minutes, but the shame lasted considerably longer. The team now calls me “the scheduler whisperer,” which is not the compliment it sounds like.
The real power comes from chaining these services. A Monitoring alert triggers Eventarc, which invokes a Cloud Function, which checks something via Scheduler, which then triggers another function to remediate. It is a Rube Goldberg machine built of code, more complex than it needs to be, but weirdly satisfying when it works. I have built systems that heal themselves, which is either the pinnacle of DevOps achievement or the first step towards Skynet. I prefer to think it is the former.
The map we all pretend to understand
Every DevOps journey, no matter how anecdotal, eventually requires what consultants call a “high-level architecture overview” and what I call a desperate attempt to comprehend the incomprehensible. During my second year on GCP, I created exactly such a diagram to explain to our CFO why we were spending $47,000 a month on something called “Cross-Regional Egress.” The CFO remained unmoved, but the diagram became my Rosetta Stone for navigating the platform’s ten core services.
I’ve reproduced it here partly because I spent three entire afternoons aligning boxes in Lucidchart, and partly because even the most narrative-driven among us occasionally needs to see the forest’s edge while wandering through the trees. Consider it the technical appendix you can safely ignore, unless you’re the poor soul actually implementing any of this.
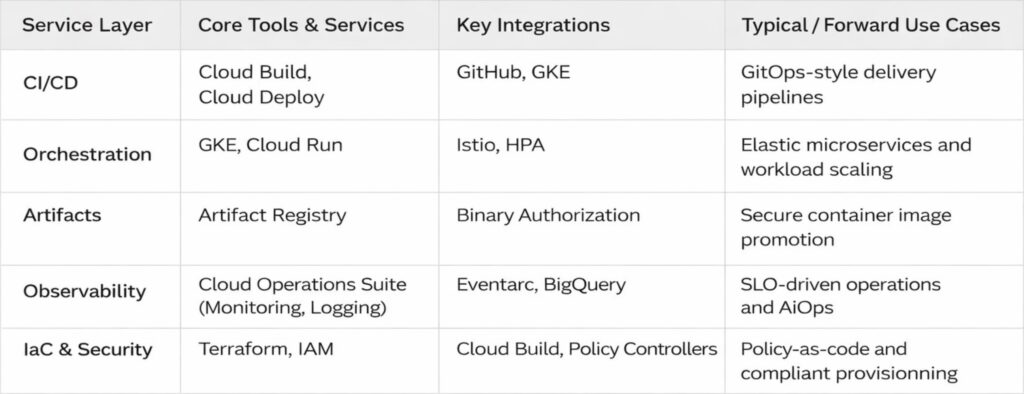
There it is, in all its tabular glory. Five rows that represent roughly fifteen thousand hours of human effort, and at least three separate incidents involving accidentally deleted production namespaces. The arrows are neat and tidy, which is more than can be said for any actual implementation.
I keep a laminated copy taped to my monitor, not because I consult it; I have the contents memorised, along with the scars that accompany each service, but because it serves as a reminder that even the most chaotic systems can be reduced to something that looks orderly on PowerPoint. The real magic lives in the gaps between those tidy boxes, where service accounts mysteriously expire, where network policies behave like quantum particles, and where the monthly bill arrives with numbers that seem generated by a random number generator with a grudge.
A modest proposal for surviving GCP
That table represents the map. What follows is the territory, with all its muddy bootprints and unexpected cliffs.
After three years, I have learned that the best DevOps engineers are not the ones with the most certificates. They are the ones who have learned to read the runes, who know which logs matter and which can be ignored, who have developed an intuitive sense for when a deployment is about to fail and can smell a misconfigured IAM binding at fifty paces. They are part sysadmin, part detective, part wizard.
The platform makes many things possible, but it does not make them easy. It is infrastructure for grown-ups, which is to say it trusts you to make expensive mistakes and learn from them. My advice is to start small, automate everything, and keep a sense of humour. You will need it the first time you accidentally delete a production bucket and discover that the undo button is marked “open a support ticket and wait.”
Store your manifests in Git and let Cloud Deploy handle the applying. Define SLOs and let the machines judge you. Tag resources for cost allocation and prepare to be horrified by the results. Replicate artifacts across regions because the internet is not as reliable as we pretend. And above all, remember that the cloud is not magic. It is simply other people’s computers running other people’s code, orchestrated by APIs that are occasionally documented and frequently misunderstood.
We build on these foundations because they let us move faster, scale further, and sleep slightly better at night, knowing that somewhere in a data centre in Belgium, a robot is watching our servers and will wake us only if things get truly interesting.
That is the theory, anyway. In practice, I still keep my phone on loud, just in case.