Let’s talk about the cloud, specifically, the tangled web of networks we build inside AWS. You spin up your Virtual Private Clouds (VPCs), toss in some subnets, sprinkle in a few security groups, configure those route tables, and before you know it, you’ve got a more complex network than a Rube Goldberg machine. Everything works great… until it doesn’t. A connection fails, an application times out, and you’re left scratching your head. Where do you even begin to troubleshoot?
This is the exact headache that AWS Reachability Analyzer is designed to cure. It is not the most known tool in the AWS toolbox, but believe me, it’s a lifesaver when diagnosing network connectivity issues. This article will explore what Reachability Analyzer is, how this handy tool works its magic, and why you should use it to keep your AWS network humming along smoothly.
What exactly is AWS Reachability Analyzer?
So, what’s the deal with Reachability Analyzer? Think of it as your network detective. It’s a configuration analysis tool that lets you test the connectivity between a source and a destination within your AWS environment. The beauty of it is that it doesn’t send any live traffic. Instead, it does something much smarter.
This nifty tool analyzes your network configuration, your security groups, Network Access Control Lists (NACLs), route tables, and all that jazz. It then builds a virtual model of your network and simulates the path that traffic would take. This way it determines whether packets starting their journey at the source could reach their intended destination.
Reachability Analyzer is part of the VPC service but tightly integrates with AWS Network Manager. If you’re dealing with a global network spanning multiple regions, Network Manager lets you run these reachability analyses centrally, giving you a bird’s-eye view of connectivity across your entire infrastructure.
It’s essential to understand what Reachability Analyzer doesn’t do. It won’t test your application-level connectivity or tell you anything about latency. It strictly focuses on the network layer, making sure the path is clear, based on your setup. It also does not take into account firewall rules of the OS, or the capacity of the resources to handle the traffic.
The perks of using Reachability Analyzer
Why bother with Reachability Analyzer? Let me break down the key benefits:
Pinpoint Connectivity Problems Fast: No more endless digging through logs or running manual traceroutes. Reachability Analyzer quickly identifies the root cause of connectivity issues, saving you precious time and frustration.
Validate Your Network Setup: It helps ensure your network is configured exactly as you intended and that your security policies are correctly enforced.
Plan Network Changes with Confidence: Before making any changes to your network, you can use Reachability Analyzer to simulate the impact and avoid accidental outages.
Boost Your Security Posture: By uncovering potential configuration flaws, it helps you strengthen your network’s defenses.
Easy Peasy to Use: The interface is intuitive. You don’t need to be a networking guru to use it effectively.
Identify Components Involved: It shows you hop-by-hop the details of the virtual path between the origin and the destination, giving you visibility of the resources involved in the connection.
Reachability Analyzer in Action
Let’s get our hands dirty with some practical examples to see how Reachability Analyzer shines in real-world scenarios:
Scenario 1 – EC2 Instance Can’t Talk to RDS Database
Your application running on an EC2 instance is throwing a tantrum and can’t connect to your RDS database, even though they’re in the same VPC. Reachability Analyzer to the rescue! You set up an analysis between the EC2 instance’s Elastic Network Interface (ENI) and the RDS instance’s ENI.
Bam! Reachability Analyzer might reveal that the RDS security group is the culprit. It’s not allowing inbound traffic from the EC2 instance’s security group on the database port. The problem is identified, and you can fix the security group rule with surgical precision.
Scenario 2 – Testing Connectivity After Route Table Tweaks
You’ve just modified a route table to direct traffic between two subnets through a firewall. Now you need to be sure that connectivity is still working as expected.
Simply create an analysis between an instance in the source subnet and one in the destination subnet. Reachability Analyzer will show you the complete path, including the hop through the firewall. If there’s a hiccup in the route table or the firewall configuration, you’ll spot it immediately.
Scenario 3 – VPN Connectivity Woes You’ve set up a VPN connection between your VPC and your on-premise network, but your users are complaining that they can’t access resources on-premise. Time to bring in Reachability Analyzer.
Run an analysis from an instance in your VPC to an IP address of a server in your on-premise network. Reachability Analyzer might show you that your subnet’s route table is missing a route to the on-premise network via the Virtual Private Gateway (VGW). Or maybe there is a problem with the configuration of your VPN tunnel. The results will give you the clues you need to troubleshoot the VPN setup.
Scenario 4 – Transit Gateway Validation You are using a Transit Gateway to connect multiple VPCs, and you need to verify connectivity between them.
Configure tests between instances in different VPCs attached to the Transit Gateway. Reachability Analyzer will show you if the Transit Gateway route tables are correctly configured and if the VPCs can communicate through the resource. It can also help determine if there are asymmetric routing issues, where traffic flows in one direction but not the other.
How to use Reachability Analyzer
Ready to give it a spin? Here’s a simple step-by-step guide:
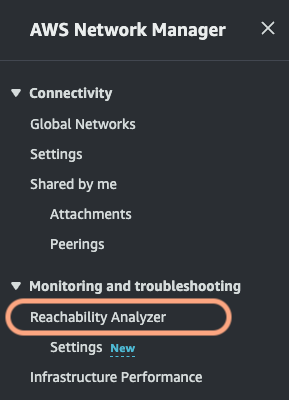
Access the Tool: Head over to the AWS Management Console, navigate to the VPC section, and you’ll find Reachability Analyzer there. Or, if you are using Network Manager, you can find it in that section.
Create an Analysis:
.- Select your source and destination. This could be an EC2 instance, an ENI, an Internet Gateway, a VPN Gateway, and more.
.- Specify the protocol (TCP or UDP) and optionally, the destination port.
.- If needed and applicable, enter the source IP address or port.
Run the Analysis: Hit the “Create and run analysis path” button and let Reachability Analyzer do its thing.
Interpret the Results:
.- The tool will tell you if the destination is “Reachable” or “Not reachable.”
.- If there’s a problem, it will provide a detailed breakdown of the path, showing you exactly which component is blocking the connection and an explanation of why.
Run the Analysis from Network Manager: If you have a global network, run the reachability analysis from Network Manager for a broader view.
Wrapping Up
AWS Reachability Analyzer is a powerful tool that simplifies network troubleshooting and gives you greater control over your AWS environment. It’s like having X-ray vision for your network. So, next time you encounter a connectivity mystery in your AWS setup, don’t panic. Fire up Reachability Analyzer, and you will have answers in minutes. Try it out, experiment, and unlock the secrets of your network.
Imagine you’re a detective, but instead of a smoky backroom, your case involves the intricate workings of your cloud applications. Your clues? Logs. Reams and reams of digital logs. Traditionally, sifting through logs is like searching for a needle in a digital haystack, tedious and time-consuming. But what if you could see those clues, those crucial log entries, appear right before your eyes, as they happen? That’s where Amazon CloudWatch Logs and its nifty feature, Live Tail, come into play.
Amazon CloudWatch Logs is the central hub for all sorts of logs generated by your applications, services, and resources within the vast realm of AWS. Think of it as a meticulous record keeper, diligently storing every event, every error, every whisper of activity within your cloud environment. But within this record keeper, you have Live Tail. This is a game changer for anyone who wants to monitor their cloud environment.
Understanding Amazon CloudWatch Logs Live Tail
So, what’s the big deal with Live Tail? Well, picture this: instead of refreshing your screen endlessly, hoping to catch that crucial log entry, Live Tail delivers them to you in real time, like a live news feed for your application’s inner workings. No more waiting, no more manual refreshing. It’s like having X-ray vision for your logs.
How does it achieve this feat of real-time magic? Using WebSockets, establish a persistent connection to your chosen log group. Think of it as a dedicated hotline between your screen and your application’s logs. Once connected, any new log event in the group is instantly streamed to your console.
But Live Tail isn’t just about speed; it’s about smart observation. It offers a range of key features, such as:
Real-time Filtering: You can tell Live Tail to only show you specific types of log entries. Need to see only errors? Just filter for “ERROR.” Looking for a specific user ID? Filter for that. It’s like having a super-efficient assistant that only shows you the relevant clues. You can even get fancy and use regular expressions for more complex searches.
Highlighting Key Terms: Spotting crucial information in a stream of text can be tricky. Live Tail lets you highlight specific words or phrases, making them pop out like a neon sign in the dark.
Pause and Resume: Need to take a closer look at something that whizzed by? Just hit pause, analyze the log entry, and then resume the live stream whenever you’re ready.
View Multiple Log Groups Simultaneously: Keep your eyes on various log groups all at the same time.
The Benefits Unveiled
Now, why should you care about all this real-time log goodness? The answer is simple: it makes your life as a developer, operator, or troubleshooter infinitely easier. Let’s break down the perks:
Debugging and Troubleshooting at Warp Speed: Imagine an error pops up in your application. With Live Tail, you see it the moment it happens. You can quickly trace the error back to its source, understand the context, and squash that bug before it causes any major headaches. This is a far cry from the old days of digging through mountains of historical logs.
Live Monitoring of Applications and Services: Keep a watchful eye on your application’s pulse. Observe how it behaves in the wild, in real time. Detect strange patterns, unexpected spikes in activity, or anything else that might signal trouble brewing.
Boosting Operational Efficiency: Less time spent hunting for problems means more time for building, innovating, and, well, maybe even taking a coffee break without worrying about your application falling apart.
Getting Started with Live Tail A Simple Guide
Alright, let’s get our hands dirty. Setting up Live Tail is a breeze. Here’s a simplified walkthrough:
Head over to the Amazon CloudWatch console in your AWS account.
Find CloudWatch Logs and start a Live Tail session.
Select the log group or groups, you want to observe.
If you want, set up some filters and highlighting rules to focus on the important stuff.
Hit start, and watch the logs flow in real time!
Use the pause and resume functions if you need them.
In the Wild
To truly grasp the power of Live Tail, let’s look at some practical scenarios:
Scenario 1 The Case of the Web App Errors: Your web application is throwing errors, but you don’t know why. Using Live Tail you start a session, filter for error messages, and almost instantly see the error and all the context surrounding it, allowing you to pinpoint the cause swiftly.
Scenario 2 Deploying a New Release: You’re rolling out a new version of your software. With Live Tail, you can monitor the deployment process, watching for any errors or hiccups, and ensuring a smooth transition.
Scenario 3 API Access Monitoring: You want to track requests to your API in real-time. Live Tail allows you to see who’s accessing your API, and what they’re requesting, and spot any unusual activity or potential security threats as they occur.
Final Thoughts
Amazon CloudWatch Logs Live Tail is like giving your detective a superpower. It transforms log analysis from a tedious chore into a dynamic, real-time experience. By providing instant insights into your application’s behavior, it empowers you to troubleshoot faster, monitor more effectively, and ultimately build better, more resilient systems. Live Tail is an essential tool in your cloud monitoring arsenal, working seamlessly with other CloudWatch features like Metrics, Alarms, and Dashboards to give you a complete picture of your cloud environment’s health. So, why not give it a try and see the difference it can make? You might just find yourself wondering how you ever lived without it.
Let’s discuss something near and dear to every AWS Architect and DevOps Engineer’s heart: resilience. Or, as I like to call it, “making sure your digital baby doesn’t throw a tantrum when things go sideways.”
We’ve all been there. Like a magnificent sandcastle, you build this beautiful, intricate system in the cloud. It’s got auto-scaling, high availability, and the works. You’re feeling pretty proud of yourself. Then, BAM! Some unforeseen event, a tiny ripple in the force of the internet, and your sandcastle starts to crumble. Panic ensues.
But what if, instead of waiting for disaster to strike, you could be a bit… mischievous? What if you could poke and prod your system before it has a meltdown in front of your users? Enter AWS Fault Injection Simulator (FIS), a service that’s about as well-known as a quiet librarian at a rock concert, but far more useful.
What’s this FIS thing, anyway?
Think of FIS as your friendly neighborhood chaos monkey but with a PhD in engineering and a strict code of conduct. It’s a fully managed service that lets you run controlled chaos experiments on your AWS workloads. Yes, you read that right. You can intentionally break things but in a safe and measured way. It is like playing Jenga but only for advanced players.
Why would you do that, you ask? Well, my friends, it’s all about finding those hidden weaknesses before they become major headaches. It’s like giving your application a stress test, similar to how doctors check your heart’s health. You want to see how it handles the pressure before it’s out there running a marathon in the real world. The idea is simple: you don’t know how strong the dam will be until you put the river on it.
Why is this CHAOS stuff so important?
In the old days (you know, like five years ago), we tested for predictable failures. Server goes down? No problem, we have a backup! But the cloud is a complex beast, and failures can be, well, weird. Latency spikes, partial network outages, API throttling… it’s a jungle out there.
FIS helps you simulate these real-world, often unpredictable scenarios. By deliberately injecting faults, you expose how your system behaves under stress. This way you will discover if your great ideas in whiteboards are translated into a great and resilient system in the cloud.
This isn’t just about avoiding downtime, though that’s a big plus. It’s about:
Improving Reliability: Find and fix weak points, leading to a more robust and dependable system.
Boosting Performance: Identify bottlenecks and optimize your application’s response under duress.
Validating Your Assumptions: Does your fancy auto-scaling work as intended? FIS will tell you.
Building Confidence: Knowing your system can handle the unexpected gives you peace of mind. And maybe, just maybe, you can sleep through the night without getting paged. A DevOps Engineer can dream, right?
Let’s get our hands dirty (Virtually, of course)
So, how does this magical chaos tool work? FIS operates through experiment templates. These are like recipes for disaster (the good kind, of course). In these templates, you define:
Actions: What kind of mischief do you want to unleash? FIS offers a menu of pre-built actions, like:
aws:ec2:stop-instances: Stop EC2 instances. You pick which ones.
aws:ec2:terminate-instances: Terminate EC2 instances. Poof, they are gone.
aws:ssm:send-command: Run a script on an instance that causes, for example, CPU stress, or memory stress.
aws:fis:inject-api-latency: Add latency to internal or external APIs.
Targets: Where do you want to inject these faults? You can target specific EC2 instances, ECS clusters, EKS clusters, RDS databases… You get the idea. You can select the resources by tags, by name, by percentage… You have plenty of options here.
Stop Conditions: This is your “emergency brake.” You define CloudWatch alarms that, if triggered, will automatically halt the experiment. Safety first, people! Imagine that the experiment is affecting more components than expected, the stop condition will be your friend here.
IAM Role: This role is very important. It will give the FIS service permission to inject the fault into your resources. Remember to assign only the necessary permissions, nothing more.
Once you’ve crafted your experiment template, you can run it and watch the magic (or mayhem) unfold. FIS provides detailed logs and integrates with CloudWatch, so you can monitor the impact in real time.
FIS in the Wild
Let’s say you have a microservices architecture running on ECS. You want to test how your system handles the failure of a critical service. With FIS, you could create an experiment that:
Action: Terminates a percentage of the tasks in your critical service.
Target: Your ECS service, specifically the tasks tagged as “critical-service.”
Stop Condition: A CloudWatch alarm that triggers if your application’s latency exceeds a certain threshold or the error rate increases.
By running this experiment, you can observe how your other services react, whether your load balancing works as expected, and if your system can gracefully recover.
Or, imagine you want to test the resilience of your RDS database. You could simulate a failover by:
Action: aws:rds:reboot-db-instance with the failover option set to true.
Target: Your primary RDS instance.
Stop Condition: A CloudWatch alarm that monitors the database’s availability.
This allows you to validate your read replica setup and ensure a smooth transition in case of a real-world primary instance failure.
I remember one time I was helping a startup that had a critical application running on EC2. They were convinced their auto-scaling was flawless. We used FIS to simulate a sudden surge in traffic by terminating a bunch of instances. Guess what? Their auto-scaling took longer to kick in than they expected, leading to a brief period of performance degradation. Thanks to the experiment, they were able to fix the issue, avoiding real user impact in the future.
My Two Cents (and Maybe a Few More)
I’ve been around the AWS block a few times, and I can tell you that FIS is a game-changer. It’s not just about breaking things; it’s about understanding things. It’s about building systems that are not just robust on paper but resilient in the face of the unpredictable chaos of the real world.
Don’t you feel like your data in the cloud is a bit too… exposed? Like you’ve got a treasure chest full of valuable information (your S3 bucket), but it’s just sitting there, practically begging for unwanted attention? You wouldn’t leave your valuables out in the open in the real world, would you? Well, the same logic applies to your data in the cloud.
This is where AWS S3 Access Points come in. They act like bouncers for your data, ensuring only the right people get in. And for those of you with data scattered across the globe, we’ve got something even fancier: Multi-Region Access Points (MRAPs). They’re like the global positioning system for your data, ensuring fast access no matter where you are.
So buckle up, and let’s explore the fascinating world of S3 Access Points and MRAPs. Let’s try to make it fun.
The problem is that your S3 Bucket is wide open (By Default)
Think of an S3 bucket as a giant storage locker in the cloud. When you first create one, it’s like leaving the locker door wide open. Anyone who knows the lockers there can just waltz in and take a peek, or worse, start messing with your stuff.
This might be fine if you’re just storing cat memes, but what if you have sensitive customer data, financial records, or top-secret project files? You need a way to control who gets in and what they can do.
The solution is the Access Points, your data’s bouncers
Imagine Access Points as the bouncers standing guard at the entrance of your storage locker. They check IDs, make sure everyone’s on the guest list, and only let in the people you’ve authorized.
In more technical terms, an Access Point is a unique hostname that you create to enforce distinct permissions and network controls for any request made through it. You can configure each Access Point with its own IAM policy, tailored to specific use cases.
Why you need Access Points. It’s all about control
Here’s the deal:
Granular Access Control: You can create different Access Points for different applications or teams, each with its own set of permissions. Maybe your marketing team only needs read access to product images, while your developers need full read and write access to application logs. Access Points make this a breeze.
Simplified Policy Management: Instead of one giant, complicated bucket policy, you can have smaller, more manageable policies for each Access Point. It’s like having a separate rule book for each group that needs access.
Enhanced Security: By restricting access through specific Access Points, you reduce the risk of accidental data exposure or unauthorized modification. It’s like having multiple layers of security for your precious data.
Compliance Made Easier: Many industries have strict regulations about data access and security (think GDPR, HIPAA). Access Points help you meet these requirements by providing a clear and auditable way to control who can access what.
Let’s get practical with an Access Point policy example
Okay, let’s see how this works in practice. Here’s an example of an Access Point policy that only allows access to a bucket named “pending-documentation” and only permits read and write actions (no deleting!):
Effect: “Allow” means this statement grants permission.
Principal: This specifies who is granted access. In this case, it’s the IAM user “Alice” (you’d replace this with the actual ARN of your user or role).
Action: The S3 actions allowed. Here, it’s s3:GetObject (read) and s3:PutObject (write).
Resource: This is the crucial part. It specifies the resource the policy applies to. Here, it’s the “pending-documentation” bucket accessed through the “my-access-point” Access Point. The /* at the end means all objects within that bucket path.
Delegating access control to the Access Point (Bucket Policy)
You also need to configure your S3 bucket policy to delegate access control to the Access Point. Here’s an example:
This policy allows any principal (“AWS”: “*”) to perform any S3 action (“s3:*”), but only if the request goes through the specified Access Point ARN.
Taking it global, Multi-Region Access Points (MRAPs)
Now, let’s say your data is spread across multiple AWS regions. Maybe you have users all over the world, and you want them to have fast access to your data, no matter where they are. This is where Multi-Region Access Points (MRAPs) come to the rescue!
Think of an MRAP as a smart global router for your data. It’s a single endpoint that automatically routes requests to the closest copy of your data in one of your S3 buckets across multiple regions.
Why Use MRAPs? Think speed and resilience
Reduced Latency: MRAPs ensure that users are always accessing the data from the nearest region, minimizing latency and improving application performance. It is like having a fast-food in each country, so clients can have their orders faster.
High Availability: If one region becomes unavailable, MRAPs automatically route traffic to another region, ensuring your application stays up and running. It’s like having a backup generator for your data.
Simplified Management: Instead of managing multiple endpoints for different regions, you have one MRAP to rule them all.
MRAPs vs. Regular Access Points, what’s the difference?
While both are about controlling access, MRAPs take it to the next level:
Scope: Regular Access Points are regional; MRAPs are multi-regional.
Focus: Regular Access Points primarily focus on security and access control; MRAPs add performance and availability to the mix.
Complexity: MRAPs are a bit more complex to set up because you’re dealing with multiple regions.
When to unleash the power of Access Points and MRAPs
Data Lakes: Use Access Points to create secure “zones” within your data lake, granting different teams access to only the data they need.
Content Delivery: MRAPs can accelerate content delivery to users around the world by serving data from the nearest region.
Hybrid Cloud: Access Points can help integrate your on-premises applications with your S3 data in a secure and controlled manner.
Compliance: Meeting regulations like GDPR or HIPAA becomes easier with the fine-grained access control provided by Access Points.
Global Applications: If you have a globally distributed application, MRAPs are essential for delivering a seamless user experience.
Lock down your data and speed up access
AWS S3 Access Points and Multi-Region Access Points are powerful tools for managing access to your data in the cloud. They provide the security, control, and performance that modern applications demand.
Your browser instantly connects you to your desired website when you type in its address and hit enter. It’s a seamless experience we often take for granted. But behind this seemingly simple action lies a complex system that makes it all possible: the Domain Name System (DNS). Think of DNS as the internet’s global directory, translating human-readable domain names into the numerical IP addresses that computers use to communicate. And when managing DNS with reliability and scalability, AWS Route 53 takes center stage. Route 53 is Amazon’s highly available and scalable DNS service, designed to route traffic to your application’s resources with remarkable precision and minimal latency. In this guide, we’ll demystify the most common DNS record types and show you how to use them effectively with Route 53, using practical examples.
Let’s jump into DNS records by breaking them down into simple, relatable examples and exploring real-world use cases. We’ll see how they work together, like a well-orchestrated symphony, to make the internet navigable.
The basics of DNS Records
DNS records are like traffic signs for the internet, directing users to the right destinations. But instead of physical signs, they’re digital entries that guide web browsers and other services. Route 53 makes managing these records straightforward. Here are the most common types:
A Record (Address Record)
Think of an A Record as the street address for your website. It maps a domain name (e.g., example.com) to an IPv4 address (e.g., 192.0.2.1). It’s the most basic thing. It just tells the internet where your website lives.
Purpose: Directs traffic to web servers or other IPv4 resources.
Analogy: Imagine telling a friend to visit you at your home address, that’s what an A Record does for websites. It’s like saying, “Hey, if you’re looking for example.com, it’s over at this IP address.”
Use Case: Hosting a website like example.com on an EC2 instance or an on-premises server.
CNAME Record (Canonical Name)
A CNAME Record is like a nickname for your domain. It maps an alias domain name (e.g., www.example.com) to another “canonical” domain name (e.g., example.com).
Purpose: Simplifies management by allowing multiple domains to point to the same resource. It’s like having various roads leading to the same destination.
Analogy: It’s like calling your friend “Bob” instead of “Robert.” Both names point to the same person.
Use case: Scaling applications by mapping api.example.com to an Application Load Balancer’s DNS name, such as app-load-balancer-456.amazonaws.com. You point your CNAME to the load balancer, and the load balancer handles distributing traffic to your servers.
AAAA Record (Quad A Record)
For the modern internet, AAAA Records map domain names to IPv6 addresses (e.g., 2001:db8::1).
Purpose: Ensures compatibility with IPv6 resources, which is becoming increasingly important as the internet grows.
Analogy: Think of this as an upgrade to a new address system for the internet, ready for the future. It’s like moving from a local phone system to a global one.
Use case: Enabling access to your website via IPv6. This ensures your site is reachable by devices using the newer IPv6 standard.
MX Record (Mail Exchange)
MX Records ensure emails sent to your domain arrive at the correct mail server.
Purpose: Routes emails to the appropriate mail server.
Analogy: Like sorting mail at a post office to send it to the right address. Each piece of mail (email) needs to be directed to the correct recipient (mail server).
Use case: Configuring email for domains with Google Workspace or Microsoft 365. This ensures your emails are handled by the right service.
NS Record (Name Server)
NS Records delegate a domain or subdomain to specific name servers.
Purpose: Specifies which servers are authoritative for answering DNS queries for a domain. In other words, they know all the A records, CNAME records, etc., for that domain.
Analogy: It’s like asking a specific guide for directions within a city. That guide knows the specific area inside and out.
Use case: Delegating subdomains like dev.example.com to a different DNS provider, perhaps for testing purposes.
TXT Record (Text Record)
TXT Records store arbitrary text data, often used for domain verification or email security configurations (e.g., SPF, DKIM).
Purpose: Provides information to external systems.
Analogy: Think of it as posting a sign with instructions outside your door. This sign might say, “To verify you own this house, please show this specific code.”
Use case: Adding SPF, DKIM, and DMARC records to prevent email spoofing and improve email deliverability. This helps ensure your emails don’t end up in spam folders.
Alias Record
Exclusive to AWS, Alias Records map domain names to AWS resources like S3 buckets or CloudFront distributions without needing an IP address.
Purpose: Reduces costs and simplifies DNS management, especially within the AWS ecosystem.
Analogy: A direct shortcut to AWS resources without the extra steps. Think of it as a secret tunnel directly to your destination, bypassing traffic.
Use case: Mapping example.com to a CloudFront distribution for CDN integration. This allows for faster content delivery to users around the world. Or, say you have a static website hosted on S3. An Alias record can point your domain directly to the S3 bucket, without needing a separate web server.
Putting it all together
Let’s look at how these records work in harmony to power your website. See? It’s not so complicated when you break it down. Each record has its job, and they all work together like a well-oiled machine.
Hosting a scalable website
Register your domain: Let’s say you register example.com using Route 53.
Create an A Record: You map example.com to an EC2 instance’s IP address where your website is hosted.
Add a CNAME Record: For www.example.com, you create a CNAME pointing to example.com. This way, both addresses lead to your site.
Utilize Alias Records: To speed up content delivery, you create an Alias record connecting example.com to a CloudFront distribution. This caches your website content at edge locations closer to your users. And shall we use another Alias Record to connect static.example.com to an S3 bucket, to serve your images faster? Why not.
Implement TXT Records: You add TXT records for email authentication (SPF, DKIM) to ensure your emails are trusted and delivered reliably.
Enable health checks: Route 53 can automatically monitor the health of your EC2 instances and route traffic away from unhealthy ones, ensuring your site stays up even if a server has issues. Route 53 can even automatically remove unhealthy instances from your DNS records.
This setup ensures high availability, scalability, and secure communication. But what makes Route 53 special? It’s not just about creating these records; it’s about doing it reliably and efficiently. Route 53 is designed for high availability and low latency. It uses a global network of DNS servers to ensure your website is always reachable, even if one server or region has problems. That means faster loading times for your users, no matter where they are.
Closing thoughts
AWS Route 53 isn’t just about creating DNS records, it’s about building robust, scalable, and secure internet infrastructure. It’s about making sure your website is always available to your users, no matter what. It’s like having a team of incredibly efficient digital postal workers who know exactly how to deliver each data packet to its correct destination. And what’s fascinating is that, like a well-designed metro system, Route 53 operates on multiple levels: it can direct traffic based on latency, geolocation, or even the health status of your services. Consider for a moment the massive scale at which services like Netflix or Amazon operate, keeping their platforms running smoothly with millions of simultaneous users. Part of that magic happens thanks to services like Route 53. The beauty of it all lies in its apparent simplicity for the end user, everything works seamlessly, but behind the scenes, there’s a complex orchestration of systems working in perfect harmony. It’s like a symphony where each DNS record is a different instrument, and Route 53 is the conductor ensuring everything sounds exactly as it should.
Let’s talk buffets. You’ve got your “all-access” pass. The one that lets you roam freely, sampling a bit of everything the dining hall offers. That’s your “regional” pass. Then you’ve got the “specialist” pass, unlimited servings, but only at that one table with the perfectly cooked prime rib. This, my friends, is the heart of the matter when we’re talking about Regional and Zonal Reserved Instances (RIs) in the world of Amazon Web Services (AWS). Let’s break it down.
Think of Reserved Instances (RIs) as pre-paid meal tickets for your cloud computing needs. You commit to using a certain amount of computing power for a year or three, and in return, Amazon gives you a hefty discount compared to paying by the hour (on-demand pricing). It’s like saying, “Hey Amazon, I’m gonna need a lot of computing power. Can you give me a better price if I promise to use it?”
Now, within this world of RIs, you have two main flavors: Regional and Zonal.
Regional RIs the flexible diners
These are your “roam around the buffet” passes. They’re not tied to a specific table (Availability Zone or AZ, in AWS lingo).
AZ flexibility: You can use your computing power in any AZ within a specific region. If one table is full, no problem, just move to another. If your application can work in any part of the region, it’s all good.
Instance size flexibility: This is like saying you can use your meal ticket for a large plate, a medium one, or even just a small snack, as long as it’s from the same food group (instance family). A t3.large reservation, for instance, can be used as a t3.medium or even a t3.xlarge, it uses a normalization factor to do it.
Automatic discount: The discount applies automatically to any instance in the region that matches the attributes of your RI. You don’t have to do any special configurations.
But there’s a catch (isn’t there always?). Regional RIs don’t guarantee you a seat at any specific table. If it’s a popular buffet (a busy AZ), and you need a seat there, you might be out of luck.
Zonal RIs the reserved table crowd
These are for those who know exactly what they want and where they want it.
Capacity reservation in a specific AZ: You’re reserving a specific table at the buffet. You’re guaranteed to have a seat (computing power) in that particular AZ.
No size flexibility: You need to choose exactly your plate size. Your reservation only applies to the exact instance type and size you picked. If you reserved a table for roast beef, you can’t use it for the pasta, sadly.
Discount locked to your AZ: Your discount only works at your reserved table, in the specific AZ you’ve chosen.
So, when do you pick one over the other?
Go Regional when:
Your app is flexible: It can run happily in any AZ within a region. You care more about the discount than about being tied to a specific location. You like flexibility.
You want maximum savings: You want to squeeze every penny of savings by taking advantage of instance size flexibility.
You like things simple: Easier management, no need to juggle reservations across different AZs.
Use cases: Think web applications with load balancing, development, and testing environments, or batch processing jobs. They don’t care too much where they are located, just that they have the power to do what they have to do.
Go Zonal when:
You need guaranteed capacity: You absolutely, positively need computing power in a specific AZ. For example, maybe your app needs to be close to your users in a certain area of the world.
Your app is picky about location: Some apps need to be in a specific AZ for latency, compliance, or architectural reasons. Maybe you have a database that needs to be super close to your application server.
You know your needs: You have a good handle on your future computing needs in that specific AZ.
Use cases: Think primary databases that need to be close to the application layer, mission-critical applications that demand high availability in a single AZ.
A real example to chew on
Imagine you’re running a popular online game. Your player base is spread across a whole region. You use Regional RIs for your game servers because they’re load-balanced and can handle players connecting from anywhere in the region. You take advantage of the Regional flexibility.
But your game’s main database? That needs to be rock-solid and always available in a specific AZ for the lowest latency. For that, you’d use a Zonal RI, reserving capacity to ensure it’s always there when your players need it.
The Bottom Line
Choosing between Regional and Zonal RIs is about understanding your application’s needs and your priorities. It’s like choosing between a flexible buffet pass or a reserved table. Both can be great, it just depends on what you’re hungry for. If you want flexibility and maximum savings, go Regional. If you need guaranteed capacity in a specific location, go Zonal.
So, there you have it. Hopefully, this makes the world of AWS Reserved Instances a bit clearer, and perhaps a bit more appetizing. Now, if you’ll excuse me, all this talk of food has made me hungry. I’m off to find a buffet… I mean, to optimize some cloud instances. 🙂
Suppose you’re constructing a complex house. You wouldn’t just glance at the front door to check if everything is fine, you’d inspect the foundation, wiring, plumbing, and how everything connects. Modern cloud applications demand the same thoroughness, and AWS CloudWatch acts as your sophisticated inspector. In this article, let’s explore some advanced features of CloudWatch that often go unnoticed but can transform your cloud observability.
The art of smart alerting with composite alarms
Think back to playing with building blocks as a kid. You could stack them to build intricate structures. CloudWatch’s composite alarms work the same way. Instead of triggering an alarm every time one metric exceeds a threshold, you can combine multiple conditions to create smarter, context-aware alerts.
For instance, in a critical web application, high CPU usage alone might not indicate an issue, it could just be handling a traffic spike. But combine high CPU with increasing error rates and declining response times, and you’ve got a red flag. Here’s an example:
CompositeAlarm:
  - Condition: CPU Usage > 80% for 5 minutes
  AND
  - Condition: Error Rate > 1% for 3 minutes
  AND
  - Condition: Response Time > 500ms for 3 minutes
Take this a step further with Anomaly Detection. Instead of rigid thresholds, Anomaly Detection learns your system’s normal behavior patterns and adjusts dynamically. It’s like having an experienced operator who knows what’s normal at different times of the day or week. You select a metric, enable Anomaly Detection, and configure the expected range based on historical data to enable this.
Exploring Step Functions and CloudWatch Insights
Now, let’s dive into a less-discussed yet powerful feature: monitoring AWS Step Functions. Think of Step Functions as a recipe, each step must execute in the right order. But how do you ensure every step is performing as intended?
CloudWatch provides detective-level insights into Step Functions workflows:
Tracing State Flows: Each state transition is logged, letting you see what happened and when.
Identifying Bottlenecks: Use CloudWatch Logs Insights to query logs and find steps that consistently take too long.
Smart Alerting: Set alarms for patterns, like repeated state failures.
Here’s a sample query to analyze Step Functions performance:
fields @timestamp, @message
| filter type = "TaskStateEntered"
| stats avg(duration) as avg_duration by stateName
| sort by avg_duration desc
| limit 5
Armed with this information, you can optimize workflows, addressing bottlenecks before they impact users.
Managing costs with CloudWatch optimization
Let’s face it, unexpected cloud bills are never fun. While CloudWatch is powerful, it can be expensive if misused. Here are some strategies to optimize costs:
1. Smart metric collection
Categorize metrics by importance:
Critical metrics: Collect at 1-minute intervals.
Important metrics: Use 5-minute intervals.
Nice-to-have metrics: Collect every 15 minutes.
This approach can significantly lower costs without compromising critical insights.
2. Log retention policies
Treat logs like your photo library: keep only what’s valuable. For instance:
Security logs: Retain for 1 year.
Application logs: Retain for 3 months.
Debug logs: Retain for 1 week.
Set these policies in CloudWatch Log Groups to automatically delete old data.
3. Metric filter optimization
Avoid creating a separate metric for every log event. Use metric filters to extract multiple insights from a single log entry, such as response times, error rates, and request counts.
Exploring new frontiers with Container Insights and Cross-Account Monitoring
Container Insights
If you’re using containers, Container Insights provides deep visibility into your containerized environments. What makes this stand out? You can correlate application-specific metrics with infrastructure metrics.
For example, track how application error rates relate to container restarts or memory spikes:
Managing multiple AWS accounts can be a complex challenge, especially when trying to maintain a consistent monitoring strategy. Cross-account monitoring in CloudWatch simplifies this by allowing you to centralize your metrics, logs, and alarms into a single monitoring account. This setup provides a “single pane of glass” view of your AWS infrastructure, making it easier to detect issues and streamline troubleshooting.
How it works:
Centralized Monitoring Account: Designate one account as your primary monitoring hub.
Sharing Metrics and Dashboards: Use AWS Resource Access Manager (RAM) to share CloudWatch data, such as metrics and dashboards, between accounts.
Cross-Account Alarms: Set up alarms that monitor metrics from multiple accounts, ensuring you’re alerted to critical issues regardless of where they occur.
Example: Imagine an organization with separate accounts for development, staging, and production environments. Each account collects its own CloudWatch data. By consolidating this information into a single account, operations teams can:
Quickly identify performance issues affecting the production environment.
Correlate anomalies across environments, such as a sudden spike in API Gateway errors during a new staging deployment.
Maintain unified dashboards for senior management, showcasing overall system health and performance.
Centralized monitoring not only improves operational efficiency but also strengthens your governance practices, ensuring that monitoring standards are consistently applied across all accounts. For large organizations, this approach can significantly reduce the time and effort required to investigate and resolve incidents.
How CloudWatch ServiceLens provides deep insights
Finally, let’s talk about ServiceLens, a feature that integrates CloudWatch with X-Ray traces. Think of it as X-ray vision for your applications. It doesn’t just tell you a request was slow, it pinpoints where the delay occurred, whether in the database, an API, or elsewhere.
Here’s how it works: ServiceLens combines traces, metrics, and logs into a unified view, allowing you to correlate performance issues across different components of your application. For example, if a user reports slow response times, you can use ServiceLens to trace the request’s path through your infrastructure, identifying whether the issue stems from a database query, an overloaded Lambda function, or a misconfigured API Gateway.
Example: Imagine you’re running an e-commerce platform. During a sale event, users start experiencing checkout delays. Using ServiceLens, you quickly notice that the delay correlates with a spike in requests to your payment API. Digging deeper with X-Ray traces, you discover a bottleneck in a specific DynamoDB query. Armed with this insight, you can optimize the query or increase the DynamoDB capacity to resolve the issue.
This level of integration not only helps you diagnose problems faster but also ensures that your monitoring setup evolves with the complexity of your cloud applications. By proactively addressing these bottlenecks, you can maintain a seamless user experience even under high demand.
Takeaways
AWS CloudWatch is more than a monitoring tool, it’s a robust observability platform designed to meet the growing complexity of modern applications. By leveraging its advanced features like composite alarms, anomaly detection, and ServiceLens, you can build intelligent alerting systems, streamline workflows, and maintain tighter control over costs.
A key to success is aligning your monitoring strategy with your application’s specific needs. Rather than tracking every metric, focus on those that directly impact performance and user experience. Start small, prioritizing essential metrics and alerts, then incrementally expand to incorporate advanced features as your application grows in scale and complexity.
For example, composite alarms can reduce alert fatigue by correlating multiple conditions, while ServiceLens provides unparalleled insights into distributed applications by unifying traces, logs, and metrics. Combining these tools can transform how your team responds to incidents, enabling faster resolution and proactive optimization.
With the right approach, CloudWatch not only helps you prevent costly outages but also supports long-term improvements in your application’s reliability and cost efficiency. Take the time to explore its capabilities and tailor them to your needs, ensuring that surprises are kept at bay while your systems thrive.
Suppose you’re conducting an orchestra where musicians can appear and disappear at will. Some charge premium rates, while others offer discounted performances but might leave mid-symphony. That’s essentially what orchestrating AWS Batch with Spot Instances feels like. Sounds intriguing. Let’s explore the mechanics of this symphony together.
What is AWS Batch, and why use it?
AWS Batch is a fully managed service that enables developers, scientists, and engineers to efficiently run hundreds, thousands, or even millions of batch computing jobs. Whether you’re processing large datasets for scientific research, rendering complex animations, or analyzing financial models, AWS Batch allows you to focus on your work. At the same time, it manages compute resources for you.
One of the most compelling features of AWS Batch is its ability to integrate seamlessly with Spot Instances, On-Demand Instances, and other AWS services like Step Functions, making it a powerful tool for scalable and cost-efficient workflows.
Optimizing costs with Spot instances
Here’s something that often gets overlooked: using Spot Instances in AWS Batch isn’t just about cost-saving, it’s about using them intelligently. Think of your job queues as sections of the orchestra. Some musicians (On-Demand instances) are reliable but costly, while others (Spot Instances) are economical but may leave during the performance.
For example, we had a data processing pipeline that was costing a fortune. By implementing a hybrid approach with AWS Batch, we slashed costs by 70%. Here’s how:
This hybrid strategy ensures that your workloads are both cost-effective and resilient, making the most out of Spot Instances while safeguarding critical jobs.
Managing complex workflows with Step Functions
AWS Step Functions acts as the conductor of your data processing symphony, orchestrating workflows that use AWS Batch. It ensures that tasks are executed in parallel, retries are handled gracefully, and failures don’t derail your entire process. By visualizing workflows as state machines, Step Functions not only make it easier to design and debug processes but also offer powerful features like automatic retry policies and error handling. For example, it can orchestrate diverse tasks such as pre-processing, batch job submissions, and post-processing stages, all while monitoring execution states to ensure smooth transitions. This level of control and automation makes Step Functions an indispensable tool for managing complex, distributed workloads with AWS Batch.
Here’s a simplified pattern we’ve used repeatedly:
This setup scales seamlessly and keeps the workflow running smoothly, even when Spot Instances are interrupted. The resilience of Step Functions ensures that the “show” continues without missing a beat.
Achieving zero-downtime updates
One of AWS Batch’s underappreciated capabilities is performing updates without downtime. The trick? A modified blue-green deployment strategy:
Create a new compute environment with updated configurations.
Create a new job queue linked to both the old and new compute environments.
Gradually shift workloads by adjusting the order of compute environments.
Drain and delete the old environment once all jobs are complete.
Batch processing efficiency often hinges on container start-up times. We’ve seen scenarios where jobs spent more time booting up than processing data. Multi-stage builds and container reuse offer a powerful solution to this problem. By breaking down the container build process into stages, you can separate dependency installation from runtime execution, reducing redundancy and improving efficiency. Additionally, reusing pre-built containers ensures that only incremental changes are applied, which minimizes build and deployment times. This strategy not only accelerates job throughput but also optimizes resource utilization, ultimately saving costs and enhancing overall system performance.
Here’s a Dockerfile that cut our start-up times by 80%:
# Build stage
FROM python:3.9 AS builder
WORKDIR /app
COPY requirements.txt .
RUN pip install --user -r requirements.txt

# Runtime stage
FROM python:3.9-slim
WORKDIR /app
COPY --from=builder /root/.local /root/.local
COPY . .
ENV PATH=/root/.local/bin:$PATH
This approach ensures your containers are lean and quick, significantly improving job throughput.
Final thoughts
AWS Batch is like a well-conducted orchestra: its efficiency lies in the harmony of its components. By combining Spot Instances intelligently, orchestrating workflows with Step Functions, and optimizing container performance, you can build a robust, cost-effective system.
The goal isn’t just to process data, it’s to process it efficiently, reliably, and at scale. AWS Batch empowers you to handle fluctuating workloads, reduce operational overhead, and achieve significant cost savings. By leveraging the flexibility of Spot Instances, the precision of Step Functions, and the speed of optimized containers, you can transform your workflows into a seamless and scalable operation.
Think of AWS Batch as a toolbox for innovation, where each component plays a crucial role. Whether you’re handling terabytes of genomic data, simulating financial markets, or rendering complex animations, this service provides the adaptability and resilience to meet your unique needs.
Microservices are all the rage these days, and for good reason. They offer a more flexible and scalable way to build applications compared to the old monolithic approach. However, with many independent services running around, things can get complex very quickly. This is where event-driven architecture shines, providing a robust way to manage and orchestrate microservices for better scalability, resilience, and agility.
1. Introduction
Imagine your application as a bustling city. In the past, we built applications like massive skyscrapers, and monolithic structures that housed everything in one place. But, just like cities evolve, so does software development. Modern development is more like constructing a city filled with smaller, specialized buildings that each have a specific purpose. These buildings communicate and collaborate to get things done efficiently.
This microservices approach is crucial because it allows developers to build more complex and scalable applications while remaining agile and responsive to changes. Event-driven microservices, in particular, add flexibility by enabling communication through events, allowing services to act independently and asynchronously.
2. Fundamentals of microservices architecture
2.1 Core characteristics
Think of microservices as a well-coordinated team. Each member, or service, has a specific role:
Small, focused services: Each service is specialized, doing one thing well.
Autonomy and loose coupling: Services operate independently and communicate through well-defined interfaces, like team members collaborating on a shared task.
Independent data management: Each service manages its own data, ensuring data isolation and consistency.
Team ownership: Teams take ownership of the entire lifecycle of a service, from development to deployment and maintenance.
Resilient design: Services are designed to handle failures gracefully, preventing cascading failures and maintaining overall system stability.
2.2 Key advantages
This approach provides several benefits:
Agile development and deployment: Smaller services are easier to develop, test, and deploy, allowing rapid iterations and responsiveness to market demands.
Independent scalability: Each service can scale independently, optimizing resource utilization and reducing costs.
Enhanced fault tolerance: If one service fails, the rest of the system can continue operating, ensuring high availability.
Technological flexibility: Each service can use the most suitable technology, allowing teams to adopt the latest tools without being restricted by previous technology choices.
Alignment with DevOps: Microservices work well with modern practices like DevOps and Continuous Integration/Continuous Delivery (CI/CD), enabling faster and more reliable releases.
3. Communication patterns in microservices
3.1 API Gateway
The API Gateway is like the central hub of our city, directing all communication traffic smoothly. It provides a single entry point for requests, manages authentication, and routes requests to the appropriate services. It also helps with cross-cutting concerns like rate limiting and caching.
3.2 Communication strategies
Microservices can communicate in various ways:
Synchronous communication (REST/HTTP): This is like a direct phone call between services, one service makes a request to another and waits for a response. It’s straightforward but can lead to bottlenecks and dependencies.
Asynchronous communication (Message Queues): This is akin to sending a letter, one service sends a message to a queue, and the receiver processes it at its own pace. This promotes loose coupling and improves resilience.
Events and streaming: Like a public announcement system, one service publishes an event, and interested services subscribe and respond. This allows for real-time, scalable communication and is a key concept in event-driven architecture.
4. Event-Driven Architecture
Event-driven architecture is like a well-choreographed dance, where services react to events and trigger actions, each one moving in perfect synchrony without stepping on the toes of another. Just as dancers respond to cues, these services pick up signals and perform their designated tasks, creating a seamless flow of information and actions. This ensures that every service is aware of what it needs to do without a central authority dictating every move, allowing for flexibility and real-time responsiveness which is crucial in modern, dynamic applications.
4.1 Choreography vs Orchestration
Choreography: Imagine a group of dancers responding to each other’s moves without a central conductor. Each dancer is attuned to the others, watching for subtle shifts in movement and adjusting their own steps accordingly. In this approach, services listen for events and react independently, much like dancers who intuitively adapt to the rhythm and flow of the music around them. There is no central authority giving instructions, yet the performance feels harmonious and coordinated. This decentralized system allows each service to be agile, responding quickly to changes without the overhead of a central controller, making it ideal for complex environments where flexibility and adaptability are key.
Orchestration: Now picture an orchestra led by a conductor. The conductor signals each musician on when to start, how fast to play, and when to stop. In the same way, a central orchestrator manages the workflow, telling each service what to do and when. This level of centralized control can ensure that everything happens in the correct sequence, avoiding chaos and making sure all services are well synchronized. However, just like an orchestra depends heavily on the conductor, this approach introduces a potential single point of failure. If the orchestrator fails, the entire flow can come to a halt, making resilience planning critical in this setup. To mitigate this, redundancy and failover mechanisms are essential to maintain reliability.
The choice between choreography and orchestration depends on your specific needs. Choreography offers greater flexibility, allowing services to react independently and adapt quickly to changes, but it comes with less centralized control, which can make coordination challenging in more complex workflows. On the other hand, orchestration provides a high level of oversight, with a central authority ensuring all tasks happen in the right sequence. This can simplify the management of dependencies but at the cost of added complexity and potential bottlenecks. Ultimately, the decision hinges on the trade-off between autonomy and control, as well as the nature of the system’s requirements.
4.2 Event streaming
Event streaming can be thought of as a live news feed, providing a continuous stream of data that services can tap into. This enables real-time processing, allowing applications to respond to changes as they happen, such as fraud detection, personalized recommendations, or IoT analytics.
Example with AWS: Using Amazon Kinesis, you can create a streaming pipeline where data is continuously ingested, processed, and analyzed in real time. Imagine an online retail platform that needs to process user activity data, such as clicks, searches, and purchases. Amazon Kinesis acts like a real-time news broadcast where every click or search is an event being transmitted live. Different microservices listen to this data stream simultaneously. One service might update personalized recommendations based on what a user has searched for, another service might monitor suspicious activity in real-time to detect fraud, and yet another might aggregate data for business analytics, such as identifying popular products or customer behavior trends. By using Amazon Kinesis, these services can work concurrently on the same data stream, turning raw data into actionable insights immediately, much like how a news broadcast informs different departments (such as marketing, sales, and security) to take distinct actions based on the same information. This ensures that business demands are met proactively and services can adapt quickly to changing conditions.
5. Failure handling and resilience
No system is immune to failures, and that’s why effective failure-handling mechanisms are vital. Imagine a traffic signal failure in a busy city intersection, without a plan, it could lead to chaos, but with traffic officers stepping in, the flow is managed, minimizing the impact. In event-driven microservices, disruptions can lead to cascading failures if not managed correctly. Implementing robust failure handling strategies ensures that individual services can fail without bringing down the entire system, ultimately making the architecture more resilient and maintaining user trust. Designing for failure from the start helps maintain high availability, supports graceful degradation, and keeps the application responsive even under adverse conditions.
5.1 Fault tolerance strategies
Circuit breakers: Similar to an electrical fuse, they prevent cascading failures by stopping requests to a service that is currently failing.
Retry patterns: If a request fails, the system retries later, assuming the issue is temporary.
Dead letter queues (DLQs): When a message can’t be processed, it is placed in a DLQ for later inspection and troubleshooting.
5.2 Idempotency
Idempotency ensures that an operation can be safely retried without adverse effects. It means that no matter how many times the same operation is performed, the outcome will always be the same, provided that the input remains unchanged. This concept is crucial in distributed systems because failures can lead to retries or repeated messages. Without idempotency, these repetitions could result in unintended consequences like duplicated records, inconsistent data states, or faulty processing.
To achieve idempotency, operations must be designed in such a way that their result remains consistent even when performed multiple times. For example, an operation that deducts from an account balance must first check if it has already processed a particular request to avoid double deductions.
This is essential for handling repeated events and ensuring consistency in distributed systems.
Example: In AWS Lambda, you can use an idempotent function to guarantee that event replays from Amazon SQS won’t alter data incorrectly. By using unique transaction IDs or checking existing state before performing actions, Lambda functions can maintain consistency and prevent unintended side effects.
6. Cloud implementation
The cloud provides an ideal platform for building event-driven microservices, offering scalability, resilience, and flexibility that traditional infrastructures often lack. AWS, in particular, has a rich ecosystem of services designed to support event-driven architectures, making it easier to deploy, manage, and scale microservices. By leveraging these cloud-native tools, developers can focus on business logic while benefiting from built-in reliability and automated scaling.
6.1 Serverless computing
Serverless computing is like renting an apartment instead of owning a house, you don’t have to worry about maintenance or management. AWS Lambda is perfect for microservices because it allows you to focus purely on the business logic without managing infrastructure. It also scales automatically with the volume of requests.
6.2 AWS services for Event-Driven microservices
AWS provides a variety of services to implement event-driven microservices:
Amazon SQS: A message queuing service for decoupling components and handling large volumes of requests.
Amazon SNS: A pub/sub messaging service for delivering notifications and distributing messages to multiple recipients.
Amazon Kinesis: A real-time data streaming service for analyzing and reacting to events in real-time.
AWS Lambda: A serverless compute service to run code in response to events, perfect for event-driven designs.
Amazon API Gateway: A fully managed service to create and manage APIs that can trigger AWS Lambda functions.
Practical Example: Imagine an e-commerce application where a new order triggers a Lambda function via Amazon SNS. This function processes the order, updates inventory through a microservice, and sends a notification using SNS, creating a fully automated, event-driven workflow.
7. Best practices and considerations
Building successful microservices requires careful design and planning. It involves understanding both the business requirements and technical constraints to create modular, scalable, and maintainable systems. Proper planning helps in defining service boundaries, selecting appropriate communication patterns, and ensuring each microservice is resilient and independently deployable.
7.1 Design and architecture
Optimal service size: Keep services small and focused on a single responsibility. This helps maintain simplicity and efficiency.
Data storage patterns: Choose the right data storage solution per service, whether it’s relational databases, NoSQL, or in-memory storage, based on consistency, performance, and scalability needs.
Versioning strategies: Use proper versioning to handle changes and maintain compatibility between services.
7.2 Operations
Monitoring and logging: Comprehensive logging and monitoring are crucial to track performance and identify issues. Think of it as keeping an eye on every moving part of a machine. Use AWS CloudWatch Logs to collect and analyze service logs, giving you insights into how each component is behaving. Meanwhile, AWS X-Ray helps you trace requests as they move through your microservices, much like following the path of a parcel as it moves through various distribution centers. This visibility allows you to detect bottlenecks, identify performance issues, and understand system behavior in real time, enabling faster troubleshooting and optimization.
Continuous deployment: Automate your CI/CD pipeline to deploy updates quickly and reliably. Use AWS CodePipeline in combination with Lambda to ensure new features are shipped efficiently. Continuous Deployment is about making sure that every change, once tested and verified, gets into production seamlessly. By integrating services like AWS CodeBuild, CodeDeploy, and leveraging automated testing, you create a streamlined flow from commit to deployment. This approach not only improves efficiency but also reduces human error, ensuring that your system stays up to date and can adapt to new business requirements without manual intervention.
Configuration management: Even the best-designed cities face disruptions, which is why failure-handling mechanisms are crucial. Imagine a traffic signal failure in a busy city intersection, without a plan, it could lead to chaos, but with traffic officers stepping in, the flow is managed, and the chaos is minimized. In event-driven microservices, disruptions can lead to cascading failures if not managed correctly. Implementing robust failure handling strategies ensures that individual services can fail without bringing down the entire system, ultimately making the architecture more resilient and maintaining user trust. Designing for failure from the start helps maintain high availability, supports graceful degradation, and keeps the application responsive even under adverse conditions.
8. Final Thoughts
Event-driven microservices represent a powerful way to build scalable, resilient, and highly agile applications. By adopting AWS services, such as Lambda, SNS, and Kinesis, you can simplify the complexities of distributed systems, allowing your team to focus more on the innovations that drive value rather than the intricacies of inter-service communication.
The future of software development lies in embracing distributed architectures and event-driven designs. These approaches empower teams to decouple services, enabling each one to evolve independently while maintaining harmony across the entire system. The ability to respond to events in real time allows for dynamic, adaptable systems that can handle unpredictable workloads and changing user demands. Staying ahead of the curve means not only adopting new technologies but also adapting the mindset of continuous improvement, which ensures that your applications remain robust and competitive in the ever-changing digital landscape.
Embrace the challenge with the tools AWS provides, such as serverless capabilities and event streaming, and watch as your microservices evolve into the backbone of a truly agile, modern, and resilient application ecosystem. By leveraging these tools effectively, you’ll not only simplify operations but also unlock new possibilities for rapid scaling and enhanced fault tolerance, ultimately providing the stability and flexibility needed to thrive in today’s tech world.
Managing Kubernetes workloads on AWS EKS (Elastic Kubernetes Service) is much like managing a city, you need to know how many “tenants” (Pods) you can fit into your “buildings” (EC2 instances). This might sound straightforward, but a bit more is happening behind the scenes. Each type of instance has its characteristics, and understanding the limits is key to optimizing your deployments and avoiding resource headaches.
Why Is there a pod limit per node in AWS EKS?
Imagine you want to deploy several applications as Pods across several instances in AWS EKS. You might think, “Why not cram as many as possible onto each node?” Well, there’s a catch. Every EC2 instance in AWS has a limit on networking resources, which ultimately determines how many Pods it can support.
Each EC2 instance has a certain number of Elastic Network Interfaces (ENIs), and each ENI can hold a certain number of IPv4 addresses. But not all these IP addresses are available for Pods, AWS reserves some for essential services like the AWS CNI (Container Network Interface) and kube-proxy, which helps maintain connectivity and communication across your cluster.
Think of each ENI like an apartment building, and the IPv4 addresses as individual apartments. Not every apartment is available to your “tenants” (Pods), because AWS keeps some for maintenance. So, when calculating the maximum number of Pods for a specific instance type, you need to take this into account.
For example, a t3.medium instance has a maximum capacity of 17 Pods. A slightly bigger t3.large can handle up to 35 Pods. The difference depends on the number of ENIs and how many apartments (IPv4 addresses) each ENI can hold.
Formula to calculate Max pods per EC2 instance
To determine the maximum number of Pods that an instance type can support, you can use the following formula:
Max Pods = (Number of ENIs × IPv4 addresses per ENI) – Reserved IPs
Let’s apply this to a t2.medium instance:
Number of ENIs: 3
IPv4 addresses per ENI: 6
Using these values, we get:
Max Pods = (3 × 6) – 1
Max Pods = 18 – 1
Max Pods = 17
So, a t2.medium instance in EKS can support up to 17 Pods. It’s important to understand that this number isn’t arbitrary, it reflects the way AWS manages networking to keep your cluster running smoothly.
Why does this matter?
Knowing the limits of your EC2 instances can be crucial when planning your Kubernetes workloads. If you exceed the maximum number of Pods, some of your applications might fail to deploy, leading to errors and downtime. On the other hand, choosing an instance that’s too large might waste resources, costing you more than necessary.
Suppose you’re running a city, and you need to decide how many tenants each building can support comfortably. You don’t want buildings overcrowded with tenants, nor do you want them half-empty. Similarly, you need to find the sweet spot in AWS EKS, enough Pods to maximize efficiency, but not so many that your node runs out of resources.
The apartment analogy
Consider an m5.large instance. Let’s say it has 4 ENIs, and each ENI can support 10 IP addresses. But, AWS reserves a few apartments (IPv4 addresses) in each building (ENI) for maintenance staff (essential services). Using our formula, we can estimate how many Pods (tenants) we can fit.
Number of ENIs: 4
IPv4 addresses per ENI: 10
Max Pods = (4 × 10) – 1
Max Pods = 40 – 1
Max Pods = 39
So, an m5.large can support 39 Pods. This limit helps ensure that the building (instance) doesn’t get overwhelmed and that the essential services can function without issues.
Automating the Calculation
Manually calculating these limits can be tedious, especially if you’re managing multiple instance types or scaling dynamically. Thankfully, AWS provides tools and scripts to help automate these calculations. You can use the kubectl describe node command to get insights into your node’s capacity or refer to AWS documentation for Pod limits by instance type. Automating this step saves time and helps you avoid deployment issues.
Best practices for scaling
When planning the architecture of your EKS cluster, consider these best practices:
Match instance type to workload needs: If your application requires many Pods, opt for an instance type with more ENIs and IPv4 capacity.
Consider cost efficiency: Sometimes, using fewer large instances can be more cost-effective than using many smaller ones, depending on your workload.
Leverage autoscaling: AWS allows you to set up autoscaling for both your Pods and your nodes. This can help ensure that you have the right amount of capacity during peak and off-peak times without manual intervention.
Key takeaways
Understanding the Pod limits per EC2 instance in AWS EKS is more than just a calculation, it’s about ensuring your Kubernetes workloads run smoothly and efficiently. By thinking of ENIs as buildings and IP addresses as apartments, you can simplify the complexity of AWS networking and better plan your deployments.
Like any good city planner, you want to make sure there’s enough room for everyone, but not so much that you’re wasting space. AWS gives you the tools, you just need to know how to use them.