I was holding a lukewarm Americano in my left hand and a lukewarm sense of dread in my right when the Slack notifications started arriving. It was one of those golden hour afternoons where the light hits your monitor at exactly the wrong angle, turning your screen into a mirror that reflects your own panic back at you. CloudWatch was screaming. Not the dignified beep of a minor alert, but the full banshee wail of latency charts gone vertical.
My coffee had developed that particular skin on top that lukewarm coffee gets when you have forgotten it exists. I stared at the graph. Our system, which I had personally architected with the confidence of a man who had read half a documentation page, was melting in real time. The app was not even big. We had fewer concurrent users than a mid-sized bowling league, yet there we were. Throttling errors stacked up like dirty dishes in a shared apartment kitchen. Cold starts multiplied like rabbits on a vitamin regimen. Costs were rising faster than my blood pressure, which at that moment could have powered a small turbine.
That afternoon changed how I design systems. After four years of writing Python and just enough AWS experience to be dangerous, I learned the cardinal rule. Most architectures that look elegant at small scale are just disasters wearing tuxedos. Here is how I built a Rube Goldberg machine of regret, and how I eventually stopped lighting my own infrastructure on fire.
The Godzilla Lambda and the art of overeating
At first, it felt elegant. One Lambda function to handle everything. Image resizing, email sending, report generation, user authentication, and probably the kitchen sink if I had thought to attach plumbing. One deployment. One mental model. One massive mistake.
I called it my Swiss Army knife approach. Except this particular knife weighed eighty pounds and required three weeks’ notice to open. The function had more conditional branches than a family tree in a soap opera. If the event type was ‘resize_image’, it did one thing. If it was ‘send_email’, it did another. It was essentially a diner where the chef was also the waiter, the dishwasher, and the person who had to physically restrain customers who complained about the meatloaf.
The cold starts were spectacular. My function would wake up slower than a teenager on a Monday morning after an all-night gaming session. It dragged itself into consciousness, looked around, and slowly remembered it had responsibilities. Deployments became existential gambles. Change a comma in the email formatting logic, and you risk taking down the image processing pipeline that paying customers actually cared about. Logs turned into a crime scene where every suspect had the same fingerprint.
The automation scripts I had written to manage this beast were just duct tape on top of more duct tape. They had to account for the fact that the entry point was a fragile monolith masquerading as serverless elegance.
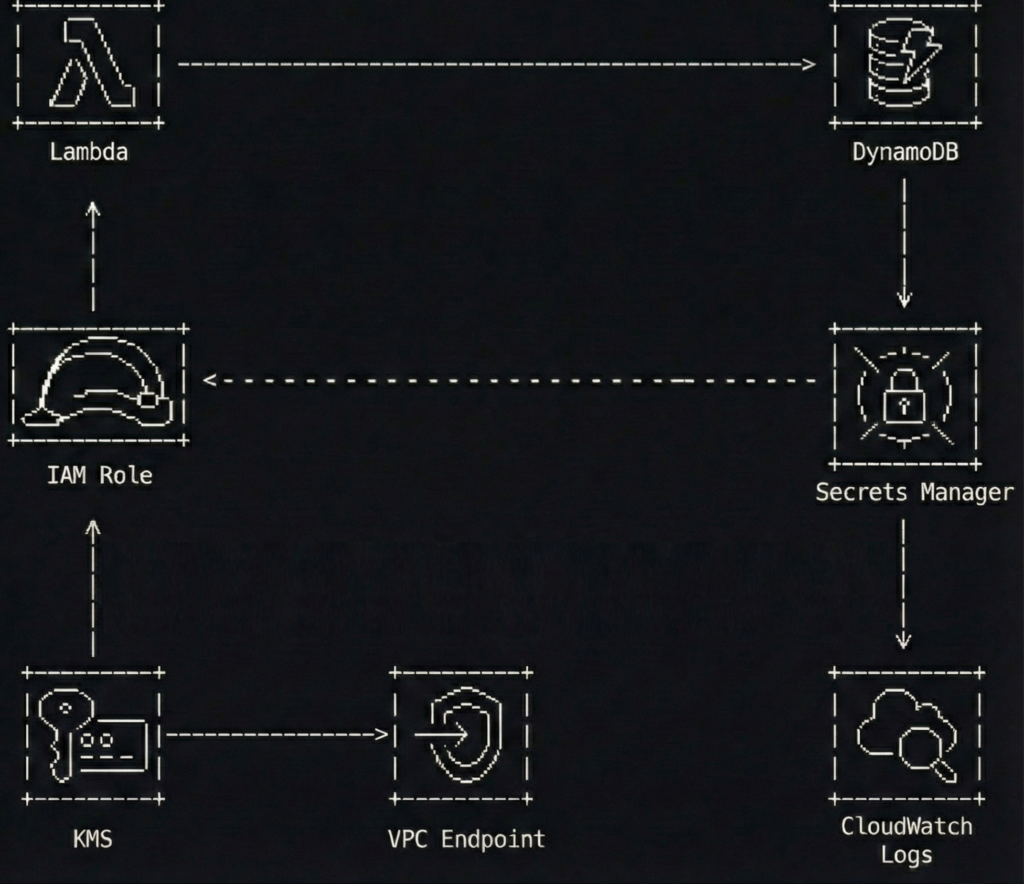
Now I build small, single-purpose functions. Each one does exactly one thing, like a very boring but highly reliable employee. My resize handler resizes. My email handler emails. They do not mingle. They do not gossip. They do not share IAM policies at the same coffee station.
Here is the only snippet of code you need to see today, mostly because it is so short it could fit in a tweet from someone with a short attention span.
def handler(event, context):
    return process_invoice(event.get("invoice_id"))
That is it. No if statements doing interpretive dance. No switch cases having an identity crisis. If a Lambda needs more than one IAM policy, it is already too big. It is like needing two different keys to open your refrigerator. If that is the case, you have designed a refrigerator incorrectly.
Using HTTP to check the mailbox
API Gateway is powerful. It is also expensive, verbose, and absolutely overkill for workflows where no human is holding a browser. I learned this the day I decided to route every single background job through API Gateway because I valued consistency over solvency. My AWS bill arrived looking like a phone number. A long one.
I was using HTTP requests for internal automation. Let that sink in. I was essentially hiring a limousine to drive across the street to check my mailbox. Every time a background job needed to trigger another background job, it went through API Gateway. That meant authentication layers, request validation, and pricing tiers designed for enterprise traffic handling, my little cron job that cleaned up temporary files.
Debugging was a nightmare wrapped in an OAuth flow. I spent three hours one Tuesday trying to figure out why an internal service could not authenticate, only to realize I had designed a system where my left hand needed to show my right hand three forms of government ID just to borrow a stapler.
The fix was to remember that computers can talk to each other without pretending to be web browsers. I switched to event-driven architecture using SNS and SQS. Now my producers throw messages into a queue like dropping letters into a mailbox, and they do not care who picks them up. The consumers grab what they need when they are ready.
sns_client = boto3.client("sns")
sns_client.publish(
    TopicArn=REPORT_GENERATION_TOPIC,
    Message=json.dumps({"customer_id": "CUST-8842", "report_type": "quarterly"})
)
The producers have no idea who consumes the message. They do not need to know. It is like leaving a note on the fridge instead of calling your roommate on their cell phone every time you need to tell them the milk is sour. If humans are not calling the endpoint, it probably should not be HTTP. Save your API Gateway budget for something that actually faces the internet, like that side project you will never finish.
The Server with amnesia
This one still stings. I used to run cron jobs on EC2 instances. Backups, cleanup scripts, data pipelines, all scheduled on a server that I treated like a reliable employee instead of the forgetful intern it actually was.
It worked perfectly until the instance restarted. Which instances do. They reboot for maintenance, for updates, for mysterious AWS reasons that arrive in emails written in that particular corporate tone that suggests everything is fine while your world burns. Every time the server came back up, it had the memory of a goldfish with a head injury. Scheduled jobs vanished into the ether. Backups did not happen. Cleanup scripts sat idle while storage costs climbed.
I spent three mornings a week SSHing into instances like a nervous parent checking if a sleeping teenager is still breathing. I would type crontab -l with the same trepidation one might use when opening a credit card statement after a vacation. Is everything there? Did it forget? Is the database backup running, or am I going to explain to the CEO why our disaster recovery plan is actually just a disaster?
If your automation depends on a server staying alive, it is not automation. It is hope dressed up in a shell script.
I replaced it with EventBridge and Lambda. EventBridge does not forget. EventBridge does not take vacations. EventBridge does not require you to log in at 3 AM in your pajamas to check if it is still breathing. It triggers the function, the function does the work, and if something breaks, it either retries or sends a message to a dead letter queue where you can ignore it at your leisure during business hours.
Trusting the Database to save itself
I trusted RDS autoscaling because the documentation made it sound intelligent. Like having a butler who watches your dinner party and quietly brings more chairs when guests arrive. The reality was more like having a butler who stands in the corner watching the house catch fire, then asks if you would like a chair.
The database would hit a traffic spike. Connections would pile up like shoppers at a Black Friday doorbuster sale. The application layer would be perfectly healthy, humming along, wondering why the database was on fire. By the time RDS autoscaling decided to add capacity, the damage was done. The connection pool had already exhausted itself. Automation scripts designed to recover the situation could not even connect to run their recovery logic. It was like calling the fire department only to find out they start driving when they smell smoke, not when the alarm rings.
Now I automate predictive scaling. It is not fancy. It is just intentional. I have scripts that check expected connection loads against current capacity. If we are going to hit five hundred connections, the script starts warming up a larger instance class before we need it. It is like preheating an oven instead of shoving a turkey into a cold metal box and hoping for the best.
AWS gives you primitives. Architecture is deciding when not to trust the defaults, because the defaults are designed to keep AWS running, not to keep you sane.
Reading tea leaves in a hurricane
I once thought centralized logging meant dumping everything into CloudWatch and calling it observability. This is the equivalent of shoveling all your mail into a closet and claiming you have a filing system. Technically true, practically useless.
My automation depended on parsing these logs. I wrote regex patterns that looked like ancient Sumerian curses. They would match error messages sometimes, ignore them other times, and occasionally trigger alerts on completely irrelevant noise because someone had logged the word error in a debugging statement about their lunch order.
During incidents, I would stare at these logs trying to find patterns. It was like trying to identify a specific scream in a horror movie marathon. Everything was urgent. Nothing was actionable. My scripts could not tell the difference between a critical database failure and a debug message about cache expiration. They were essentially reading entrails.
Structured logs saved my sanity. Now everything gets dumped as JSON with actual fields. Event types, durations, identifiers, all labeled and searchable. My automation can trigger follow-up jobs when specific events complete. It can detect anomalies by looking at actual numeric fields instead of trying to parse human-readable text like some kind of desperate fortune teller.
logger.info(
    "task_completed",
    extra={
        "job_type": "inventory_sync",
        "warehouse_id": "WH-15",
        "duration_ms": 1420,
        "items_processed": 847
    }
)
Logs are not for humans anymore. They are for systems. Humans should read dashboards. Systems should read logs. Confuse the two, and you end up with alerts that cry wolf at 3 AM because someone spelled success wrong.
The quiet killer wearing a price tag
This is the one that really hurts. Everything worked. Latency was acceptable. Automation was smooth. The system scaled. Then the bill arrived, and I nearly spilled my coffee onto the keyboard. If cost is not part of your architecture, scale will punish you like a gym teacher who has decided you need motivation.
I had built something that scaled technically but not financially. It was like designing an airplane that flies beautifully but requires fuel that costs more than the GDP of a small nation. Every request through API Gateway, every idle EC2 waiting for a cron job that might not come, every poorly optimized Lambda running for fifteen seconds because I had not bothered to trim the dependencies, it all added up.
Now I automate cost checks. Before expensive jobs run, they estimate their impact. If the daily budget threshold approaches, the system starts making choices. It defers non-critical tasks. It sends warnings. It acts like a responsible adult at a bar when the tab starts getting too high.
def should_process_batch(estimated_cost, daily_spend):
    remaining_budget = DAILY_LIMIT - daily_spend
    return estimated_cost < (remaining_budget * 0.8)
Simple guardrails save real money. There is a saying I keep taped to my monitor now. If it scales technically but not financially, it does not scale. It is just a very efficient way to go bankrupt.
The art of rehearsed failure
Every bad decision I made had the same DNA. I optimized for speed of development. I ignored the longevity of automation. I trusted defaults because reading the full documentation seemed like work for people who had more time than I did. I treated AWS like a magic wand instead of a very powerful, very expensive tool that requires respect.
Good architecture is not about services. It is about failure modes you have already rehearsed in your head. It is about assuming you will forget what you built in six months, because you will. It is about assuming growth will happen, failure will happen, and at some point, you will be trying to debug this thing while your phone buzzes with angry messages from people who just want the system to work.
Build like you are designing a kitchen for a very forgetful, very busy chef who might be slightly drunk. Label everything. Make the dangerous stuff hard to do by accident. Keep the receipts. And for the love of all that is holy, do not put cron jobs on EC2.