We all love a good glass of lemonade, right? But let’s be honest: ” One size fits all” doesn’t always work. Some like it sweet, some like it tart, and some like it with a twist. Running a successful lemonade stand or website means understanding these individual preferences. The first step? Listening to your customers, or in the case of the web, understanding the information their browsers send you.
The internet works similarly. Websites are like your lemonade stand, and users’ browsers are the customers coming up to ask for a drink. But instead of just saying “lemonade, please,” browsers send a whole bunch of information with their requests, tucked away in “headers.”
The User-Agent, your browser’s secret identity
One of these headers is the mighty “User-Agent.” Think of it as your browser’s secret identity. It tells the website, “Hey, I’m Chrome on a Windows laptop!” or “Howdy, I’m Safari on an iPhone!”
This is super important because, just like you’d tweak your lemonade recipe, websites want to serve the best experience for each device. A website designed for a big desktop screen might look cramped and clunky on a tiny phone. Using the User-Agent, the website can say, “Aha! This is a mobile user, let me send them the mobile-optimized version of my page!”
Now, let’s say your lemonade stand has become so popular that you need help. You hire someone to stand at the end of the block and direct people to you. This helper is like Amazon CloudFront, a content delivery network (CDN) that makes your website faster by storing copies of it all over the world.
CloudFront, the speedy delivery guy
CloudFront is brilliant. It’s like having mini lemonade stands everywhere, so customers get their drinks quicker. But there’s a catch. By default, CloudFront is a bit too eager to simplify things. It might think, “Lemonade is lemonade! Everyone gets the same!” and throw away some of those important headers, including the User-Agent.
This can lead to situations where users don’t get the optimal experience. For instance, mobile users might be served a clunky desktop version of a website, leading to frustration and a poor user experience. It becomes evident that CloudFront, while powerful, needs a little guidance to handle these nuances.
Behaviors, teaching CloudFront some manners
Luckily, CloudFront is a fast learner. You can teach it to handle those headers properly using “Behaviors.” Think of behaviors as special instructions you give to CloudFront. You can say things like, “Hey CloudFront, when someone asks for my website, please forward the User-Agent header to my origin server.” The “origin server” is where your website’s content ultimately resides. Typically, this is an Application Load Balancer (ALB) acting as a single point of contact and distributing traffic to a group of EC2 instances running your web application.
The solution, straight from the horse’s mouth
So, to ensure the best user experience for all visitors of a website delivered through CloudFront, you need to configure the CloudFront distribution’s behavior. Specifically, you tell it to forward the User-Agent header. This way, the website (your origin server) will know what kind of device is asking for the page and can serve the right version.
Why not add the User-Agent to the origin custom headers, as an alternative approach? Well, that’s like whispering the secret identity to the lemonade stand instead of letting the customer shout it out loud. The origin might not know what to do with that information in that format. Forwarding the header as part of the standard request is much cleaner and more reliable.
Wrapping it up, keep it simple and smart
And there you have it! The User-Agent header is a browser’s way of saying what it is, and CloudFront behaviors let you customize how your website handles that information. By understanding these simple concepts, you can make sure your website is serving the right experience to every user, whether they’re on a phone, a tablet, or a good old-fashioned desktop computer.
The internet, just like a good lemonade recipe, is all about understanding your audience and delivering the best experience possible. And sometimes, all it takes is a little tweak in the right place.
You know that feeling when you’re spring cleaning your Linux system and spot that mysterious folder lurking around forever? Your finger hovers over the delete key, but something makes you pause. Smart move! Before removing any folder, wouldn’t it be nice to know if any services are actively using it? It’s like checking if someone’s sitting in a chair before moving it. Today, I’ll show you how to do that, and I promise to keep it simple and fun.
Why should you care?
You see, in the world of DevOps and SysOps, understanding which services are using your folders is becoming increasingly important. It’s like being a detective in your own system – you need to know what’s happening behind the scenes to avoid accidentally breaking things. Think of it as checking if the room is empty before turning off the lights!
Meet your two best friends lsof and fuser
Let me introduce you to two powerful tools that will help you become this system detective: lsof and fuser. They’re like X-ray glasses for your Linux system, letting you see invisible connections between processes and files.
The lsof command as your first tool
lsof stands for “list open files” (pretty straightforward, right?). Here’s how you can use it:
lsof +D /path/to/your/folder
This command is like asking, “Hey, who’s using stuff in this folder?” The system will then show you a list of all processes that are accessing files in that directory. It’s that simple!
Let’s break down what you’ll see:
COMMAND: The name of the program using the folder
PID: A unique number identifying the process (like its ID card)
USER: Who’s running the process
FD: File descriptor (don’t worry too much about this one)
TYPE: Type of file
DEVICE: Device numbers
SIZE/OFF: Size of the file
NODE: Inode number (system’s way of tracking files)
NAME: Path to the file
The fuser command as your second tool
Now, let’s meet fuser. It’s like lsof’s cousin, but with a different approach:
fuser -v /path/to/your/folder
This command shows you which processes are using the folder but in a more concise way. It’s perfect when you want a quick overview without too many details.
Examples
Let’s say you have a folder called /var/www/html and you want to check if your web server is using it:
lsof +D /var/www/html
You might see something like:
COMMAND PID USER FD TYPE DEVICE SIZE/OFF NODE NAME
apache2 1234 www-data 3r REG 252,0 12345 67890 /var/www/html/index.html
This tells you that Apache is reading files from that folder, good to know before making any changes!
Pro tips and best practices
Always check before deleting When in doubt, it’s better to check twice than to break something once. It’s like looking both ways before crossing the street!
Watch out for performance The lsof +D command checks all subfolders too, which can be slow for large directories. For quicker checks of just the folder itself, you can use:
lsof +d /path/to/folder
Combine commands for better insights You can pipe these commands with grep for more specific searches:
lsof +D /path/to/folder | grep service_name
Troubleshooting common scenarios
Sometimes you might run these commands and get no output. Don’t panic! This usually means no processes are currently using the folder. However, remember that:
Some processes might open and close files quickly
You might need sudo privileges to see everything
System processes might be using files in ways that aren’t immediately visible
Conclusion
Understanding which services are using your folders is crucial in modern DevOps and SysOps environments. With lsof and fuser, you have powerful tools at your disposal to make informed decisions about your system’s folders.
Remember, the key is to always check before making changes. It’s better to spend a minute checking than an hour fixing it! These tools are your friends in maintaining a healthy and stable Linux system.
Quick reference
# Check folder usage with lsof
lsof +D /path/to/folder
# Quick check with fuser
fuser -v /path/to/folder
# Check specific service
lsof +D /path/to/folder | grep service_name
# Check folder without recursion
lsof +d /path/to/folder
The commands we’ve explored today are just the beginning of your journey into better Linux system management. As you become more comfortable with these tools, you’ll find yourself naturally integrating them into your daily DevOps and SysOps routines. They’ll become an essential part of your system maintenance toolkit, helping you make informed decisions and prevent those dreaded “Oops, I shouldn’t have deleted that” moments.
Being cautious with system modifications isn’t about being afraid to make changes, it’s about making changes confidently because you understand what you’re working with. Whether you’re managing a single server or orchestrating a complex cloud infrastructure, these simple yet powerful commands will help you maintain system stability and peace of mind.
Keep exploring, keep learning, and most importantly, keep your Linux systems running smoothly. The more you practice these techniques, the more natural they’ll become. And remember, in the world of system administration, a minute of checking can save hours of troubleshooting!
While everyone else is busy wrapping presents and baking cookies, we’re going to unwrap something even more exciting: the world of AWS Step Functions. Now, I know what you might be thinking: “Step Functions? That sounds about as fun as getting socks for Christmas.” But trust me, this is way cooler than it sounds.
Imagine you’re Santa Claus for a second. You’ve got this massive list of kids, a whole bunch of elves, and a sleigh full of presents. How do you make sure everything gets done on time? You need a plan, a workflow. You wouldn’t just tell the elves, “Go do stuff!” and hope for the best, right? No, you’d say, “First, check the list. Then, build the toys. Next, wrap the presents. Finally, load up the sleigh.”
That’s essentially what AWS Step Functions does for your code in the cloud. It’s like a super-organized Santa Claus for your computer programs, ensuring everything happens in the right order, at the right time.
Why use AWS Step Functions? Because even Santa needs a plan
What are Step Functions anyway?
Think of AWS Step Functions as a flowchart on steroids. It’s a service that lets you create visual workflows for your applications. These workflows, called “state machines,” are made up of different steps, or “states,” that tell your application what to do and when to do it. These steps can be anything from simple tasks to complex operations, and they often involve our little helpers called AWS Lambda functions.
A quick chat about AWS Lambda
Before we go further, let’s talk about Lambdas. Imagine you have a tiny robot that’s really good at one specific task, like tying bows on presents. That’s a Lambda function. It’s a small piece of code that does one thing and does it well. You can have lots of these little robots, each doing their own thing, and Step Functions helps you organize them into a productive team. They are like the Christmas elves of the cloud!
Why orchestrate multiple Lambdas?
Now, you might ask, “Why not just have one big, all-knowing Lambda function that does everything?” Well, you could, but it would be like having one giant elf try to build every toy, wrap every present, and load the sleigh all by themselves. It would be chaotic, and hard to manage, and if that elf gets tired (or your code breaks), everything grinds to a halt.
Having specialized elves (or Lambdas) for each task is much better. One is for checking the list, one is for building toys, one is for wrapping, and so on. This way, if one elf needs a break (or a code update), the others can keep working. That’s the beauty of breaking down complex tasks into smaller, manageable steps.
Our scenario Santa’s data dilemma
Let’s imagine Santa has a modern problem. He’s got a big list of kids and their gift requests, but it’s all in a digital file (a JSON file, to be precise) stored in a magical cloud storage called S3 (Simple Storage Service). His goal is to read this list, make sure it’s not corrupted, add some extra Christmas magic to each request (like a “Ho Ho Ho” stamp), and then store the updated list back in S3. Finally, he wants a little notification to make sure everything went smoothly.
Breaking down the task with multiple lambdas
Here’s how we can break down Santa’s task into smaller, Lambda-sized jobs:
Validation Lambda: This little helper checks the list to make sure it’s in the right format and that no naughty kids are trying to sneak extra presents onto the list.
Transformation Lambda: This is where the magic happens. This Lambda adds that special “Ho Ho Ho” to each gift request, making sure every kid gets a personalized touch.
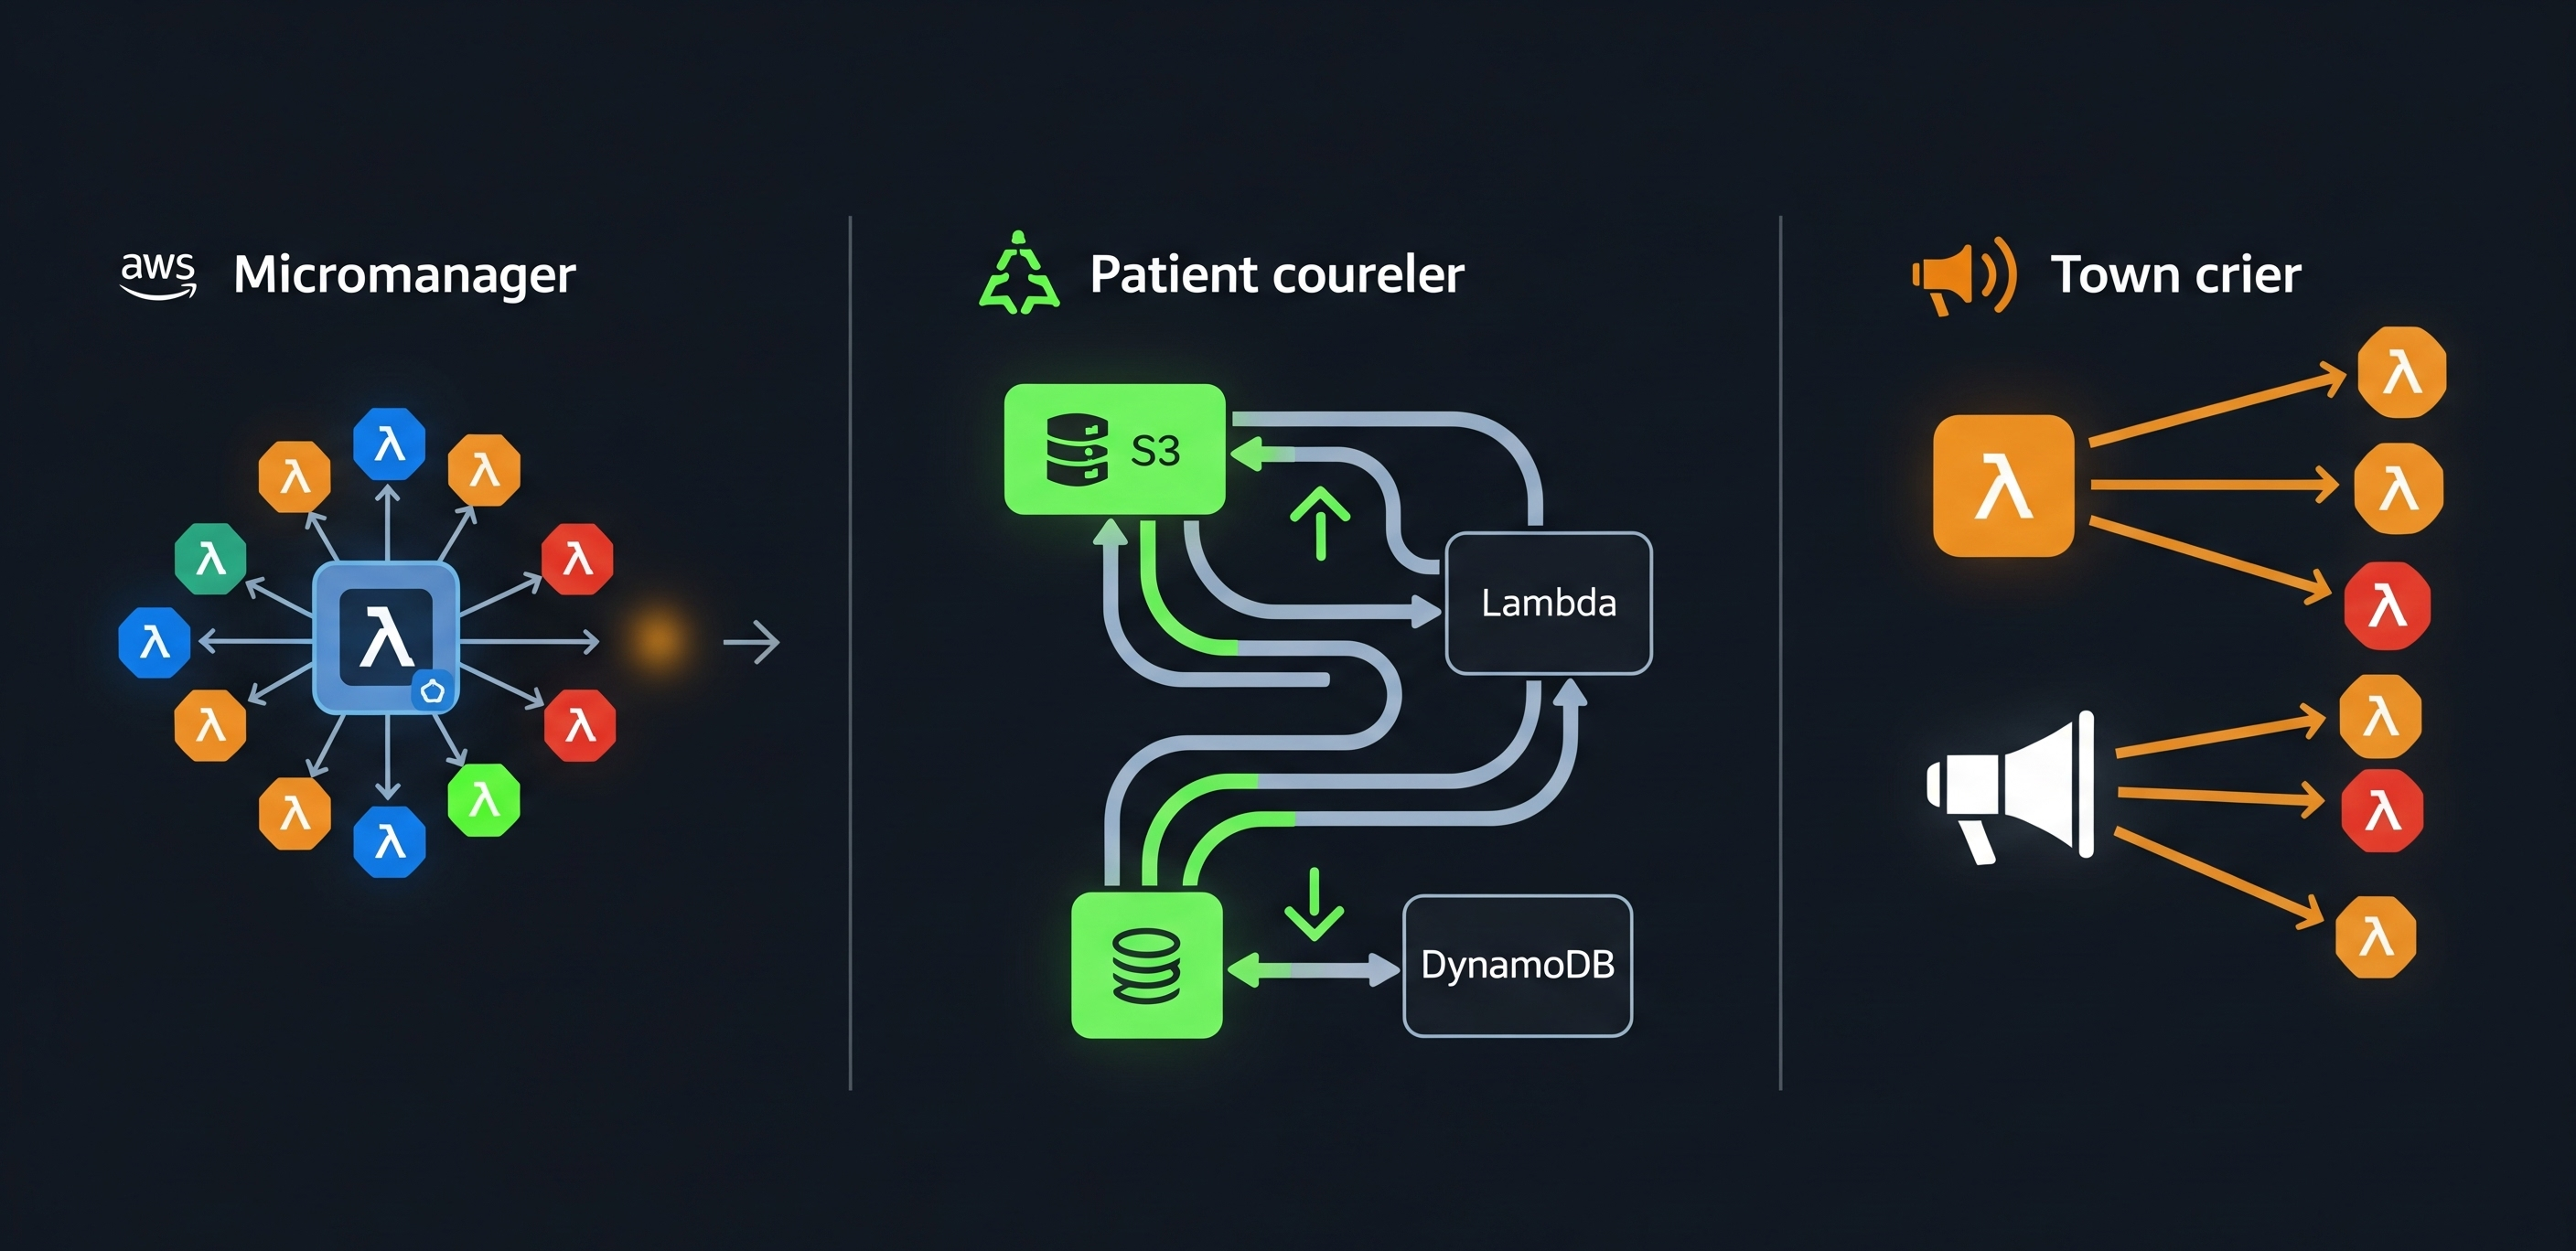
Notification Lambda: This is our town crier. Once everything is done, this Lambda shouts “Success!” (or sends a more sophisticated message) to let Santa know the job is complete.
Step Functions Santa’s master plan
This is where Step Functions comes in. It’s the conductor of our Lambda orchestra. It makes sure each Lambda function runs in the right order, passing the list from one Lambda to the next like a relay race.
Our High-Level architecture
Let’s draw a simple picture of what’s happening (even Santa loves a good diagram):
The data’s journey
The list (JSON file) lands in an S3 bucket.
This triggers our Step Functions workflow.
The Validation Lambda grabs the list, checks it, and passes the validated list to the Transformation Lambda.
The Transformation Lambda works its magic, adds the “Ho Ho Ho,” and saves the new list to another S3 bucket.
Finally, the Notification Lambda sends out a message confirming success.
The secret sauce passing data between steps
Step Functions automatically passes the output from each step as input to the next. It’s like each elf handing the partially completed present to the next elf in line. This is a crucial part of what makes Step Functions so powerful.
A look at each Lambda function
Let’s peek inside each of our Lambda functions. Don’t worry; we’ll keep it simple.
The list checker validation Lambda
This Lambda, written in Python (a very friendly programming language), does the following:
Downloads the list from S3.
Checks if the list is in the correct format (like making sure it’s actually a list and not a drawing of a reindeer).
If something’s wrong, it raises an error (handled gracefully by Step Functions).
If everything’s good, it returns the validated list.
Adding Christmas magic with the transformation Lambda
This Lambda receives the validated list and:
Adds that special “Ho Ho Ho” to each gift request.
Saves the new, transformed list to a new file in S3.
Returns the location of the newly created file.
Spreading the news with the notification Lambda
This Lambda gets the path to the transformed file and:
Could send a message to Santa’s phone, write “Success!” in the snow, or simply print a message in the cloud logs.
Marks the end of our workflow.
Configuring the state machine
Now, how do we tell Step Functions what to do? We use something called the Amazon States Language (ASL), which is just a fancy way of describing our workflow in a JSON format. Here’s a simplified snippet:
Don’t be scared by the code! It’s just a structured way of saying:
Start with “ValidateData.”
Then go to “TransformData.”
Finally, go to “Notify” and we’re done.
Each “Resource” is the address of our Lambda function in the AWS world.
Error handling for dropped tasks
What happens if an elf drops a present? Step Functions can handle that! We can tell it to retry the step or go to a special “Fix It” state if something goes wrong.
Passing output between steps
Remember how we talked about passing data between steps? Here’s a simplified example of how we tell Step Functions to do that:
This tells the “TransformData” step to take the “validatedData” from the previous step’s output and put its output in “transformedData.”
Making sure everything works before the big day
Before we unleash our workflow on the world (or Santa’s list), we need to make absolutely sure it works as expected. Testing is like a dress rehearsal for Christmas Eve, ensuring every elf knows their part and Santa’s sleigh is ready to fly.
Two levels of testing
We’ll approach testing in two ways:
Testing each Lambda individually (Local tests):
Think of this as quality control for each elf. Before they join the assembly line, we need to make sure each Lambda function does its job correctly in isolation.
We can do this right from the AWS Management Console. Simply find your Lambda function, and look for a “Test” tab or button.
You’ll be able to create test events, which are like sample inputs for your Lambda. For example, for our Validation Lambda, you could create a test event with a well-formatted JSON and another with a deliberately incorrect JSON to see if the Lambda catches the error.
Run the test and check the output. Did the Lambda behave as expected? Did it return the correct data or the proper error message?
Alternatively, if you’re comfortable with the command line, you can use the AWS CLI (Command Line Interface) to invoke your Lambdas with test data. This offers more flexibility for advanced testing.
It is very important to test each Lambda with different types of inputs to make sure it behaves well under diverse circumstances.
Testing the entire workflow (End-to-End test):
This is the grand rehearsal, where we test the whole process from start to finish.
First, prepare a sample JSON file that represents a typical Santa’s list. Make it realistic but simple enough for easy testing.
Upload this file to your designated S3 bucket. This should automatically trigger your Step Functions workflow.
Now, head over to the Step Functions section in the AWS Management Console. Find your state machine and look for the execution history. You should see a new execution that corresponds to your test.
Click on the execution. You’ll see a visual diagram of your workflow, with each step highlighted as it’s executed. This is like tracking Santa’s sleigh in real time!
Pay close attention to each step. Did it succeed? Did it take roughly the amount of time you expected? If a step fails, the diagram will show you where the problem occurred.
Once the workflow is complete, check your output S3 bucket. Is the transformed file there? Is it correctly modified according to your Transformation Lambda’s logic?
Finally, verify that your Notification Lambda did its job. Did it log the success message? Did it send a notification if that’s how you configured it?
Why both types of testing matter
You might wonder, “Why do we need both local and end-to-end tests?” Here’s the deal:
Local tests help you catch problems early on, at the individual component level. It’s much easier to fix a problem with a single Lambda than to debug a complex workflow with multiple failing parts.
End-to-end tests ensure that all the components work together seamlessly. They verify that the data is passed correctly between steps and that the overall workflow produces the desired outcome.
Debugging tips
If a step fails during the end-to-end test, click on the failed step in the Step Functions execution diagram. You’ll often see an error message that can help you pinpoint the issue.
Check the CloudWatch Logs for your Lambda functions. These logs contain valuable information about what happened during the execution, including any error messages or debug output you’ve added to your code.
Iterate and refine
Testing is not a one-time thing. As you develop your workflow, you’ll likely make changes and improvements. Each time you make a significant change, repeat your tests to ensure everything still works as expected. Remember: a well-tested workflow is a reliable workflow. By thoroughly testing our Step Functions workflow, we’re making sure that Santa’s list (and our application) is in good hands. Now, let’s get testing!
Step Functions or single Lambdas?
Maintainability and visibility
Step Functions makes it super easy to see what’s happening in your workflow. It’s like having a map of Santa’s route on Christmas Eve. This makes it much easier to find and fix problems.
Complexity
For simple tasks, a single Lambda might be enough. But as soon as you have multiple steps that need to happen in a specific order, Step Functions is your best friend.
Beyond Christmas Eve
Key takeaways
Step Functions is a powerful way to chain together Lambda functions in a visual, trackable, and error-tolerant workflow. It’s like having a super-organized Santa Claus for your cloud applications.
Potential improvements
We could add more steps, like extra validation or an automated email to parents. We could use other AWS services like SNS (Simple Notification Service) for more advanced notifications or DynamoDB for storing even more data.
Final words
This was a simple example, but the same ideas apply to much more complex, real-world applications. Step Functions can handle massive workflows with thousands of steps, making it a crucial tool for any aspiring cloud architect.
So, there you have it! You’ve now seen how AWS Step Functions can orchestrate AWS Lambdas to complete a task, just like Santa orchestrates his elves on Christmas Eve. And hopefully, it was a bit more exciting than getting socks for Christmas. 😊
Picture this, you’ve designed a top-notch, highly available architecture on AWS. Your resources are meticulously distributed across multiple Availability Zones (AZs) within a region, ensuring fault tolerance. Yet, an unexpected connectivity issue emerges between accounts. What could be the cause? The answer lies in an often-overlooked aspect of how AWS manages Availability Zones.
Understanding AWS Availability Zones
AWS Availability Zones are isolated locations within an AWS Region, designed to enhance fault tolerance and high availability. Each region comprises multiple AZs, each engineered to be independent of the others, with high-speed, redundant networking connecting them. This design makes it possible to create applications that are both resilient and scalable.
On the surface, AZs seem straightforward. AWS Regions are standardized globally, such as us-east-1 or EU-west-2. However, the story becomes more intriguing when we dig deeper into how AZ names like us-east-1a or eu-west-2b are assigned.
The quirk of AZ names
Here’s the kicker: the name of an AZ in your AWS account doesn’t necessarily correspond to the same physical location as an AZ with the same name in another account. For example, us-east-1a in one account could map to a different physical data center than us-east-1a in another account. This inconsistency can create significant challenges, especially in shared environments.
Why does AWS do this? The answer lies in resource distribution. If every AWS customer within a region were assigned the same AZ names, it could result in overloading specific data centers. By randomizing AZ names across accounts, AWS ensures an even distribution of resources, maintaining performance and reliability across its infrastructure.
Unlocking the power of AZ IDs
To address the confusion caused by randomized AZ names, AWS provides AZ IDs. Unlike AZ names, AZ IDs are consistent across all accounts and always reference the same physical location. For instance, the AZ ID use1-az1 will always point to the same physical data center, whether it’s named us-east-1a in one account or us-east-1b in another.
This consistency makes AZ IDs a powerful tool for managing cross-account architectures. By referencing AZ IDs instead of names, you can ensure that resources like subnets, Elastic File System (EFS) mounts, or VPC peering connections are correctly aligned across accounts, avoiding misconfigurations and connectivity issues.
Common AZ IDs across regions
US East (N. Virginia): use1-az1 | use1-az2 | use1-az3 | use1-az4 | use1-az5 | use1-az6
US East (Ohio): use2-az1 | use2-az2 | use2-az3
US West (N. California): usw1-az1 | usw1-az2 | usw1-az3
US West (Oregon): usw2-az1 | usw2-az2 | usw2-az3 | usw2-az4
Africa (Cape Town): afs1-az1 | afs1-az2 | afs1-az3
Why AZ IDs are essential for Multi-Account architectures
In multi-account setups, the randomization of AZ names can lead to headaches. Imagine you’re sharing a subnet between two accounts. If you rely solely on AZ names, you might inadvertently assign resources to different physical zones, causing connectivity problems. By using AZ IDs, you ensure that resources in both accounts are placed in the same physical location.
For example, if use1-az1 corresponds to a subnet in us-east-1a in your account and us-east-1b in another, referencing the AZ ID guarantees consistency. This approach is particularly useful for workloads involving shared resources or inter-account VPC configurations.
Discovering AZ IDs with AWS CLI
AWS makes it simple to find AZ IDs using the AWS CLI. Run the following command to list the AZs and their corresponding AZ IDs in a region:
The output will include the ZoneName (e.g., us-east-1a) and its corresponding ZoneId (e.g., use1-az1). Here is an example of the output when running this command in the eu-west-1 region:
By incorporating this information into your resource planning, you can build more reliable and predictable architectures.
Practical example for sharing subnets across accounts
Let’s say you’re managing a shared subnet for two AWS accounts in the us-east-1 region. Using AZ IDs ensures both accounts assign resources to the same physical AZ. Here’s how:
Run the CLI command above in both accounts to determine the AZ IDs.
Align the resources in both accounts by referencing the common AZ ID (e.g., use1-az1).
Configure your networking rules to ensure seamless connectivity between accounts.
By doing this, you eliminate the risks of misaligned AZ assignments and enhance the reliability of your setup.
Final thoughts
AWS Availability Zones are the backbone of AWS’s fault-tolerant architecture, but understanding their quirks is crucial for building effective multi-account systems. AZ names might seem simple, but they’re only half the story. Leveraging AZ IDs unlocks the full potential of AWS’s high availability and fault-tolerance capabilities.
The next time you design a multi-account architecture, remember to think beyond AZ names. Dive into AZ IDs and take control of your infrastructure like never before. As with many things in AWS, the real power lies beneath the surface.
Suppose you’re constructing a complex house. You wouldn’t just glance at the front door to check if everything is fine, you’d inspect the foundation, wiring, plumbing, and how everything connects. Modern cloud applications demand the same thoroughness, and AWS CloudWatch acts as your sophisticated inspector. In this article, let’s explore some advanced features of CloudWatch that often go unnoticed but can transform your cloud observability.
The art of smart alerting with composite alarms
Think back to playing with building blocks as a kid. You could stack them to build intricate structures. CloudWatch’s composite alarms work the same way. Instead of triggering an alarm every time one metric exceeds a threshold, you can combine multiple conditions to create smarter, context-aware alerts.
For instance, in a critical web application, high CPU usage alone might not indicate an issue, it could just be handling a traffic spike. But combine high CPU with increasing error rates and declining response times, and you’ve got a red flag. Here’s an example:
CompositeAlarm:
- Condition: CPU Usage > 80% for 5 minutes
AND
- Condition: Error Rate > 1% for 3 minutes
AND
- Condition: Response Time > 500ms for 3 minutes
Take this a step further with Anomaly Detection. Instead of rigid thresholds, Anomaly Detection learns your system’s normal behavior patterns and adjusts dynamically. It’s like having an experienced operator who knows what’s normal at different times of the day or week. You select a metric, enable Anomaly Detection, and configure the expected range based on historical data to enable this.
Exploring Step Functions and CloudWatch Insights
Now, let’s dive into a less-discussed yet powerful feature: monitoring AWS Step Functions. Think of Step Functions as a recipe, each step must execute in the right order. But how do you ensure every step is performing as intended?
CloudWatch provides detective-level insights into Step Functions workflows:
Tracing State Flows: Each state transition is logged, letting you see what happened and when.
Identifying Bottlenecks: Use CloudWatch Logs Insights to query logs and find steps that consistently take too long.
Smart Alerting: Set alarms for patterns, like repeated state failures.
Here’s a sample query to analyze Step Functions performance:
fields @timestamp, @message
| filter type = "TaskStateEntered"
| stats avg(duration) as avg_duration by stateName
| sort by avg_duration desc
| limit 5
Armed with this information, you can optimize workflows, addressing bottlenecks before they impact users.
Managing costs with CloudWatch optimization
Let’s face it, unexpected cloud bills are never fun. While CloudWatch is powerful, it can be expensive if misused. Here are some strategies to optimize costs:
1. Smart metric collection
Categorize metrics by importance:
Critical metrics: Collect at 1-minute intervals.
Important metrics: Use 5-minute intervals.
Nice-to-have metrics: Collect every 15 minutes.
This approach can significantly lower costs without compromising critical insights.
2. Log retention policies
Treat logs like your photo library: keep only what’s valuable. For instance:
Security logs: Retain for 1 year.
Application logs: Retain for 3 months.
Debug logs: Retain for 1 week.
Set these policies in CloudWatch Log Groups to automatically delete old data.
3. Metric filter optimization
Avoid creating a separate metric for every log event. Use metric filters to extract multiple insights from a single log entry, such as response times, error rates, and request counts.
Exploring new frontiers with Container Insights and Cross-Account Monitoring
Container Insights
If you’re using containers, Container Insights provides deep visibility into your containerized environments. What makes this stand out? You can correlate application-specific metrics with infrastructure metrics.
For example, track how application error rates relate to container restarts or memory spikes:
Managing multiple AWS accounts can be a complex challenge, especially when trying to maintain a consistent monitoring strategy. Cross-account monitoring in CloudWatch simplifies this by allowing you to centralize your metrics, logs, and alarms into a single monitoring account. This setup provides a “single pane of glass” view of your AWS infrastructure, making it easier to detect issues and streamline troubleshooting.
How it works:
Centralized Monitoring Account: Designate one account as your primary monitoring hub.
Sharing Metrics and Dashboards: Use AWS Resource Access Manager (RAM) to share CloudWatch data, such as metrics and dashboards, between accounts.
Cross-Account Alarms: Set up alarms that monitor metrics from multiple accounts, ensuring you’re alerted to critical issues regardless of where they occur.
Example: Imagine an organization with separate accounts for development, staging, and production environments. Each account collects its own CloudWatch data. By consolidating this information into a single account, operations teams can:
Quickly identify performance issues affecting the production environment.
Correlate anomalies across environments, such as a sudden spike in API Gateway errors during a new staging deployment.
Maintain unified dashboards for senior management, showcasing overall system health and performance.
Centralized monitoring not only improves operational efficiency but also strengthens your governance practices, ensuring that monitoring standards are consistently applied across all accounts. For large organizations, this approach can significantly reduce the time and effort required to investigate and resolve incidents.
How CloudWatch ServiceLens provides deep insights
Finally, let’s talk about ServiceLens, a feature that integrates CloudWatch with X-Ray traces. Think of it as X-ray vision for your applications. It doesn’t just tell you a request was slow, it pinpoints where the delay occurred, whether in the database, an API, or elsewhere.
Here’s how it works: ServiceLens combines traces, metrics, and logs into a unified view, allowing you to correlate performance issues across different components of your application. For example, if a user reports slow response times, you can use ServiceLens to trace the request’s path through your infrastructure, identifying whether the issue stems from a database query, an overloaded Lambda function, or a misconfigured API Gateway.
Example: Imagine you’re running an e-commerce platform. During a sale event, users start experiencing checkout delays. Using ServiceLens, you quickly notice that the delay correlates with a spike in requests to your payment API. Digging deeper with X-Ray traces, you discover a bottleneck in a specific DynamoDB query. Armed with this insight, you can optimize the query or increase the DynamoDB capacity to resolve the issue.
This level of integration not only helps you diagnose problems faster but also ensures that your monitoring setup evolves with the complexity of your cloud applications. By proactively addressing these bottlenecks, you can maintain a seamless user experience even under high demand.
Takeaways
AWS CloudWatch is more than a monitoring tool, it’s a robust observability platform designed to meet the growing complexity of modern applications. By leveraging its advanced features like composite alarms, anomaly detection, and ServiceLens, you can build intelligent alerting systems, streamline workflows, and maintain tighter control over costs.
A key to success is aligning your monitoring strategy with your application’s specific needs. Rather than tracking every metric, focus on those that directly impact performance and user experience. Start small, prioritizing essential metrics and alerts, then incrementally expand to incorporate advanced features as your application grows in scale and complexity.
For example, composite alarms can reduce alert fatigue by correlating multiple conditions, while ServiceLens provides unparalleled insights into distributed applications by unifying traces, logs, and metrics. Combining these tools can transform how your team responds to incidents, enabling faster resolution and proactive optimization.
With the right approach, CloudWatch not only helps you prevent costly outages but also supports long-term improvements in your application’s reliability and cost efficiency. Take the time to explore its capabilities and tailor them to your needs, ensuring that surprises are kept at bay while your systems thrive.
I was thinking the other day about these Kubernetes pods, and how they’re like little spaceships floating around in the cluster. But what happens if one of those spaceships suddenly vanishes? Poof! Gone! That’s a real problem. So I started wondering, how can we ensure our pods are always there, ready to do their job, even if things go wrong? It’s like trying to keep a juggling act going while someone’s moving the floor around you…
Let me tell you about this tool called Karpenter. It’s like a super-efficient hotel manager for our Kubernetes worker nodes, always trying to arrange the “guests” (our applications) most cost-effectively. Sometimes, this means moving guests from one room to another to save on operating costs. In Kubernetes terminology, we call this “consolidation.”
The dancing pods challenge
Here’s the thing: We have this wonderful hotel manager (Karpenter) who’s doing a fantastic job, keeping costs down by constantly optimizing room assignments. But what about our guests (the applications)? They might get a bit dizzy with all this moving around, and sometimes, their important work gets disrupted.
So, the question is: How do we keep our applications running smoothly while still allowing Karpenter to do its magic? It’s like trying to keep a circus performance going while the stage crew rearranges the set in the middle of the act.
Understanding the moving parts
Before we explore the solutions, let’s take a peek behind the scenes and see what happens when Karpenter decides to relocate our applications. It’s quite a fascinating process:
First, Karpenter puts up a “Do Not Disturb” sign (technically called a taint) on the node it wants to clear. Then, it finds new accommodations for all the applications. Finally, it carefully moves each application to its new location.
Think of it as a well-choreographed dance where each step must be perfectly timed to avoid any missteps.
The art of high availability
Now, for the exciting part, we have some clever tricks up our sleeves to ensure our applications keep running smoothly:
The buddy system: The first rule of high availability is simple: never go it alone! Instead of running a single instance of your application, run at least two. It’s like having a backup singer, if one voice falters, the show goes on. In Kubernetes, we do this by setting replicas: 2 in our deployment configuration.
Strategic placement: Here’s a neat trick: we can tell Kubernetes to spread our application copies across different physical machines. It’s like not putting all your eggs in one basket. We use something called “Pod Topology Spread Constraints” for this. Here’s how it looks in practice:
Setting boundaries: Remember when your parents set rules about how many cookies you could eat? We do something similar in Kubernetes with PodDisruptionBudgets (PDB). We tell Kubernetes, “Hey, you must always keep at least 50% of my application instances running.” This prevents our hotel manager from getting too enthusiastic about rearranging things.
The “Do Not Disturb” sign: For those special cases where we absolutely don’t want an application to be moved, we can put up a permanent “Do Not Disturb” sign using the karpenter.sh/do-not-disrupt: “true” annotation. It’s like having a VIP guest who gets to keep their room no matter what.
The complete picture
The beauty of this system lies in how all the pieces work together. Think of it as a safety net with multiple layers:
Multiple instances ensure basic redundancy.
Strategic placement keeps instances separated.
PodDisruptionBudgets prevent too many moves at once.
And when necessary, we can completely prevent disruption.
A real example
Let me paint you a picture. Imagine you’re running a critical web service. Here’s how you might set it up:
With these patterns in place, our applications become incredibly resilient. They can handle node failures, scale smoothly, and even survive Karpenter’s optimization efforts without any downtime. It’s like having a self-healing system that keeps your services running no matter what happens behind the scenes.
High availability isn’t just about having multiple copies of our application, it’s about thoughtfully designing how those copies are managed and maintained. By understanding and implementing these patterns, we are not just running applications in Kubernetes; we are crafting reliable, resilient services that can weather any storm.
The next time you deploy an application to Kubernetes, think about these patterns. They might just save you from that dreaded 3 AM wake-up call about your service being down!
Suppose you’re conducting an orchestra where musicians can appear and disappear at will. Some charge premium rates, while others offer discounted performances but might leave mid-symphony. That’s essentially what orchestrating AWS Batch with Spot Instances feels like. Sounds intriguing. Let’s explore the mechanics of this symphony together.
What is AWS Batch, and why use it?
AWS Batch is a fully managed service that enables developers, scientists, and engineers to efficiently run hundreds, thousands, or even millions of batch computing jobs. Whether you’re processing large datasets for scientific research, rendering complex animations, or analyzing financial models, AWS Batch allows you to focus on your work. At the same time, it manages compute resources for you.
One of the most compelling features of AWS Batch is its ability to integrate seamlessly with Spot Instances, On-Demand Instances, and other AWS services like Step Functions, making it a powerful tool for scalable and cost-efficient workflows.
Optimizing costs with Spot instances
Here’s something that often gets overlooked: using Spot Instances in AWS Batch isn’t just about cost-saving, it’s about using them intelligently. Think of your job queues as sections of the orchestra. Some musicians (On-Demand instances) are reliable but costly, while others (Spot Instances) are economical but may leave during the performance.
For example, we had a data processing pipeline that was costing a fortune. By implementing a hybrid approach with AWS Batch, we slashed costs by 70%. Here’s how:
This hybrid strategy ensures that your workloads are both cost-effective and resilient, making the most out of Spot Instances while safeguarding critical jobs.
Managing complex workflows with Step Functions
AWS Step Functions acts as the conductor of your data processing symphony, orchestrating workflows that use AWS Batch. It ensures that tasks are executed in parallel, retries are handled gracefully, and failures don’t derail your entire process. By visualizing workflows as state machines, Step Functions not only make it easier to design and debug processes but also offer powerful features like automatic retry policies and error handling. For example, it can orchestrate diverse tasks such as pre-processing, batch job submissions, and post-processing stages, all while monitoring execution states to ensure smooth transitions. This level of control and automation makes Step Functions an indispensable tool for managing complex, distributed workloads with AWS Batch.
Here’s a simplified pattern we’ve used repeatedly:
This setup scales seamlessly and keeps the workflow running smoothly, even when Spot Instances are interrupted. The resilience of Step Functions ensures that the “show” continues without missing a beat.
Achieving zero-downtime updates
One of AWS Batch’s underappreciated capabilities is performing updates without downtime. The trick? A modified blue-green deployment strategy:
Create a new compute environment with updated configurations.
Create a new job queue linked to both the old and new compute environments.
Gradually shift workloads by adjusting the order of compute environments.
Drain and delete the old environment once all jobs are complete.
Batch processing efficiency often hinges on container start-up times. We’ve seen scenarios where jobs spent more time booting up than processing data. Multi-stage builds and container reuse offer a powerful solution to this problem. By breaking down the container build process into stages, you can separate dependency installation from runtime execution, reducing redundancy and improving efficiency. Additionally, reusing pre-built containers ensures that only incremental changes are applied, which minimizes build and deployment times. This strategy not only accelerates job throughput but also optimizes resource utilization, ultimately saving costs and enhancing overall system performance.
Here’s a Dockerfile that cut our start-up times by 80%:
# Build stage
FROM python:3.9 AS builder
WORKDIR /app
COPY requirements.txt .
RUN pip install --user -r requirements.txt
# Runtime stage
FROM python:3.9-slim
WORKDIR /app
COPY --from=builder /root/.local /root/.local
COPY . .
ENV PATH=/root/.local/bin:$PATH
This approach ensures your containers are lean and quick, significantly improving job throughput.
Final thoughts
AWS Batch is like a well-conducted orchestra: its efficiency lies in the harmony of its components. By combining Spot Instances intelligently, orchestrating workflows with Step Functions, and optimizing container performance, you can build a robust, cost-effective system.
The goal isn’t just to process data, it’s to process it efficiently, reliably, and at scale. AWS Batch empowers you to handle fluctuating workloads, reduce operational overhead, and achieve significant cost savings. By leveraging the flexibility of Spot Instances, the precision of Step Functions, and the speed of optimized containers, you can transform your workflows into a seamless and scalable operation.
Think of AWS Batch as a toolbox for innovation, where each component plays a crucial role. Whether you’re handling terabytes of genomic data, simulating financial markets, or rendering complex animations, this service provides the adaptability and resilience to meet your unique needs.
Managing cloud networks at an enterprise scale is like conducting a symphony orchestra in a massive digital city. Each connection must play its part perfectly, maintaining harmony, efficiency, and security. While most AWS architects are familiar with basic VPC concepts, the real power of AWS networking lies in its advanced capabilities, which enable robust, scalable, and secure architectures.
The landscape of cloud networking evolves rapidly, and AWS continuously introduces sophisticated tools and services. The possibilities for building complex networks are endless, from VPC Lattice to Transit Gateway and IPv6 support. This article will explore advanced VPC networking patterns and practical tips to help you optimize your AWS architecture, whether managing a growing startup’s infrastructure or architecting solutions for a global enterprise.
Simplifying service communication with VPC Lattice
Remember when connecting microservices felt like untangling a spider web? Each service had its thread, carefully tied to another, and even the smallest misstep could send the whole network into chaos. AWS VPC Lattice steps in to unravel that web and replace it with a finely tuned machine, one that handles the complexity for you.
So, what exactly is VPC Lattice? Think of it as a traffic controller for your services. But unlike a traditional traffic controller, VPC Lattice doesn’t just tell cars when to stop or go, it builds the roads, sets the rules, and even hands out the maps to ensure everyone gets where they need to go. It operates across VPCs and AWS accounts, enabling seamless communication without requiring the usual tangle of custom routing, peering, or private links.
Here’s how it works: VPC Lattice creates a service network, a kind of invisible highway system, that links your microservices. It automatically handles service discovery, load balancing, and security, so you don’t have to configure these elements for every single connection. Whether a service lives in the same VPC, a different AWS account, or even across regions, VPC Lattice ensures they can communicate effortlessly and securely.
Key features of VPC Lattice:
Service Discovery and Load Balancing: Automatically finds and balances traffic between your services, regardless of their location.
Unified Access Control: Define and enforce security policies at the service level, no matter how complex the network gets.
Cross-VPC and Cross-Account communication: Forget about custom configurations, VPC Lattice bridges the gaps for you.
Real-World example
Imagine you’re running a food delivery app. You’ve got three critical services:
Order Service to handle customer orders.
Payment Service to process transactions.
Delivery Tracking Service to keep customers updated.
Traditionally, you’d need to create individual connections between each service, setting up security groups, routing tables, and load balancers for every pair. With VPC Lattice, you define these services once, add them to a service network, and let AWS handle the rest. It’s like moving from a chaotic neighborhood of one-way streets to a city grid with clear traffic signals and signs.
Why it matters
For developers and architects working with microservices, VPC Lattice isn’t just a convenience, it’s a game-changer. It reduces operational overhead, simplifies scaling, and ensures a consistent level of security and reliability, no matter how large or distributed your network becomes.
By leveraging VPC Lattice, you can focus on building and optimizing your application, not wrangling the connections between its parts.
Security Groups and NACLs, the dynamic duo of network security
Let’s demystify network security. Think of Security Groups as bouncers at a club and Network ACLs (NACLs) as the neighborhood watch. Both are essential but operate differently.
Security Groups (The Bouncers):
Stateful: They remember who’s allowed in.
Permission-focused: Only allow traffic; no blocking rules.
Instance-level: Rules are applied to individual instances.
NACLs (The Neighborhood Watch):
Stateless: Each request is treated independently.
Permission and denial rules: Can allow or deny traffic.
Subnet-level: Rules apply to all instances in a subnet.
Example: Three-Tier Application
Frontend servers in public subnets: Security Group allows HTTP/HTTPS from anywhere.
Application servers in private subnets: Security Group allows traffic only from the frontend servers.
Database in isolated subnets: Security Group allows traffic only from application servers.
Layer
Security Group
NACL
Public Subnet
Allow HTTP/HTTPS from anywhere
Block known malicious IPs
Private Subnet
Allow traffic from Public Subnet IPs
Allow only whitelisted IPs
Database Subnet
Allow traffic from Private Subnet IPs
Restrict access to private subnet traffic only
This combination ensures robust security at both granular and broader levels.
Transit gateway as the universal router
Transit Gateway acts as the central train station for your cloud network. Instead of creating direct connections between every VPC (like direct flights), it consolidates connections into a central hub.
Real-World scenario:
You manage three AWS regions: US, Europe, and Asia, each with multiple VPCs (dev, staging, prod). Without Transit Gateway, you’d need individual VPC connections, creating exponential complexity. With Transit Gateway:
Deploy a Transit Gateway in each region.
Connect VPCs to their respective Transit Gateway.
Set up Transit Gateway peering between regions.
Cost optimization tip:
Use AWS Resource Access Manager (RAM) to share Transit Gateways across accounts, reducing the need for redundant configurations and lowering networking costs.
Gateway versus Interface VPC Endpoints
Choosing the right VPC endpoint type can significantly impact your application’s performance, cost, and scalability. AWS provides two types of VPC endpoints: Gateway Endpoints and Interface Endpoints. While both facilitate private access to AWS services without using a public internet connection, they differ in how they function and the use cases they best serve.
Gateway Endpoints are simpler and more cost-effective, designed for high-throughput services like Amazon S3 and DynamoDB. They route traffic directly through your VPC’s routing table, minimizing latency and eliminating per-hour costs.
Interface Endpoints, on the other hand, provide more flexibility and are compatible with a broader range of AWS services. These endpoints utilize Elastic Network Interfaces (ENIs) within your subnets, making them ideal for use cases requiring cross-regional support or integration with third-party services. However, they come with additional hourly and data transfer costs.
Understanding the nuances between Gateway and Interface Endpoints helps you make informed decisions tailored to your application’s specific needs.
Type
Best For
Cost
Latency
Scope
Gateway Endpoints
S3, DynamoDB
Free
Low
Regional
Interface Endpoints
Most AWS services
Per-hour + Per-GB
Higher
Cross-regional
Pro tip: For high-throughput services like S3, Gateway endpoints are a better choice due to their cost-efficiency and low latency.
VPC Flow logs as your network’s black box
VPC Flow logs provide invaluable insights into network activity. They capture details about accepted and rejected traffic, helping you troubleshoot and optimize security configurations.
Practical Use:
Analyze Flow Logs with Amazon Athena for cost-effective insights. For example:
SELECT *
FROM vpc_flow_logs
WHERE (action = 'REJECT' AND dstport = 443)
AND date_partition >= '2024-01-01';
This query identifies rejected HTTPS traffic, which might indicate a misconfigured Security Group.
Preparing for the future with IPv6
As IPv4 addresses become increasingly scarce, transitioning to IPv6 is no longer just an option, it’s a necessity for future-proofing your network infrastructure. IPv6 provides a virtually limitless pool of unique IP addresses, making it ideal for modern applications that demand scalability, especially in IoT, mobile services, and global deployments.
AWS fully supports dual-stack environments, allowing you to enable IPv6 alongside IPv4 without disrupting existing setups. This approach helps you gradually adopt IPv6 while maintaining compatibility with IPv4-dependent systems. Beyond the sheer availability of addresses, IPv6 also introduces efficiency improvements, such as simplified routing and better support for auto-configuration.
Implementing IPv6 in your AWS environment requires careful planning to ensure security and compatibility with your applications. Below are the steps to help you get started.
Steps to Implement IPv6:
Enable IPv6 for your VPC.
Add IPv6 CIDR blocks to subnets.
Update route tables and security rules to include IPv6.
Start with non-production environments and gradually migrate, ensuring applications are tested with IPv6 endpoints. IPv6 addresses are free, making them a cost-effective way to future-proof your architecture.
In a Few Words
Mastering AWS VPC networking patterns is not just about understanding individual components but also knowing when and why to use them. Whether it’s simplifying service communication with VPC Lattice, optimizing inter-region connectivity with Transit Gateway, or future-proofing with IPv6, these strategies empower you to build secure, scalable, and efficient cloud architectures.
Remember: The cloud is just someone else’s computer, but with VPC, it’s your private slice of that computer. Make it count!
Suppose you need multiple applications to share files seamlessly, without worrying about running out of storage space or struggling with complex configurations. That’s where AWS Elastic File System (EFS) comes in. EFS is a fully managed, scalable file system that multiple AWS services or containers can access. In this guide, we’ll take a simple yet comprehensive journey through the process of mounting AWS EFS to an Amazon Elastic Kubernetes Service (EKS) cluster. I’ll make sure to keep it straightforward, so you can follow along regardless of your Kubernetes experience.
Why use EFS with EKS?
Before we go into the details, let’s consider why using EFS in a Kubernetes environment is beneficial. Imagine you have multiple applications (pods) that all need to access the same data—like a shared directory of documents. Instead of replicating data for each application, EFS provides a centralized storage solution that can be accessed by all pods, regardless of which node they’re running on.
Here’s what makes EFS a great choice for EKS:
Shared Storage: Multiple pods across different nodes can access the same files at the same time, making it perfect for workloads that require shared access.
Scalability: EFS automatically scales up or down as your data needs change, so you never have to worry about manually managing storage limits.
Durability and Availability: AWS ensures that your data is highly durable and accessible across multiple Availability Zones (AZs), which means your applications stay resilient even if there are hardware failures.
Typical use cases for using EFS with EKS include machine learning workloads, content management systems, or shared file storage for collaborative environments like JupyterHub.
Prerequisites
Before we start, make sure you have the following:
EKS Cluster: You need a running EKS cluster, and kubectl should be configured to access it.
EFS File System: An existing EFS file system in the same AWS region as your EKS cluster.
IAM Roles: Correct IAM roles and policies for your EKS nodes to interact with EFS.
Amazon EFS CSI Driver: This driver must be installed in your EKS cluster.
How to mount AWS EFS on EKS
Let’s take it step by step, so by the end, you’ll have a working setup where your Kubernetes pods can use EFS for shared, scalable storage.
Create an EFS file system
To begin, navigate to the EFS Management Console:
Create a New File System: Select the appropriate VPC and subnets—they should be in the same region as your EKS cluster.
File System ID: Note the File System ID; you’ll use it later.
Networking: Ensure that your security group allows inbound traffic from the EKS worker nodes. Think of this as permitting EKS to access your storage safely.
Set up IAM role for the EFS CSI driver
The Amazon EFS CSI driver manages the integration between EFS and Kubernetes. For this driver to work, you need to create an IAM role. It’s a bit like giving the CSI driver its set of keys to interact with EFS securely.
To create the role:
Log in to the AWS Management Console and navigate to IAM.
Create a new role and set up a custom trust policy:
Make sure to attach the AmazonEFSCSIDriverPolicy to this role. This step ensures that the CSI driver has the necessary permissions to manage EFS volumes.
Install the Amazon EFS CSI driver
You can install the EFS CSI driver using either the EKS Add-ons feature or via Helm charts. I recommend the EKS Add-on method because it’s easier to manage and stays updated automatically.
Attach the IAM role you created to the EFS CSI add-on in your cluster.
(Optional) Create an EFS access point
Access points provide a way to manage and segregate access within an EFS file system. It’s like having different doors to different parts of the same warehouse, each with its key and permissions.
Go to the EFS Console and select your file system.
Create a new Access Point and note its ID for use in upcoming steps.
Configure an IAM Policy for worker nodes
To make sure your EKS worker nodes can access EFS, attach an IAM policy to their role. Here’s an example policy:
You can verify the setup by checking if the pod can access the mounted storage:
kubectl exec -it efs-app -- ls /data
A note on direct EFS mounting
You can mount EFS directly into pods without using a Persistent Volume (PV) or Persistent Volume Claim (PVC) by referencing the EFS file system directly in the pod’s configuration. This approach simplifies the setup but offers less flexibility compared to using dynamic provisioning with a StorageClass. Here’s how you can do it:
Replace <file-system-id> with your EFS File System ID. This method works well for simpler scenarios where direct access is all you need.
Final remarks
Mounting EFS to an EKS cluster gives you a powerful, shared storage solution for Kubernetes workloads. By following these steps, you can ensure that your applications have access to scalable, durable, and highly available storage without needing to worry about complex management or capacity issues.
As you can see, EFS acts like a giant, shared repository that all your applications can tap into. Whether you’re working on machine learning projects, collaborative tools, or any workload needing shared data, EFS and EKS together simplify the whole process.
Now that you’ve walked through mounting EFS on EKS, think about what other applications could benefit from this setup. It’s always fascinating to see how managed services can help reduce the time you spend on the nitty-gritty details, letting you focus on building great solutions.
Imagine you’re making breakfast. You walk into the kitchen, turn on the stove, and start cooking. Simple, right? But what if you had to build a new kitchen every time you wanted to make breakfast? That would be crazy! Yet, that’s exactly what happens in cloud computing when we run traditional servers.
This is where AWS Lambda comes in. Instead of building a new kitchen (server) every time, Lambda is like having a magical kitchen that appears when you need it and disappears when you’re done. There is no maintenance, cleaning, or wasted space or energy. It sounds perfect, doesn’t it?
But here’s where it gets interesting. Just like cooking in a magical kitchen might have some quirks, like the stove taking a few extra seconds to heat up the first time you use it, Lambda has its peculiarities. We call these “cold starts,” they’re just the beginning of what makes Lambda fascinating.
Let me tell you a common story in the serverless world. A team builds an amazing application using Lambda, and everything works great… until it doesn’t. The functions start taking too long to respond, the code becomes a mess, and users around the globe complain about slowness. Sound familiar?
The morning coffee problem of cold starts
Think about making your first cup of coffee in the morning. You have to wait for the coffee maker to warm up, grind the beans, heat the water… it takes time. But once it’s warmed up, making the second cup is much faster, right?
Lambda functions work the same way. The first time you call a function, AWS has to do several things:
Find a place to run your function (like finding counter space in the kitchen)
Set up the environment (like getting out all your cooking tools)
Load your code (like reading the recipe)
Start running it (finally, making the coffee!)
This whole process can take anywhere from a few hundred milliseconds to several seconds. Now, a few seconds might not sound like much, but imagine you’re at a busy coffee shop and every customer’s first coffee took an extra 30 seconds. You’d have some unhappy customers!
Here’s how we can fix this, using what I like to call the “24-hour diner approach”. Do you know how diners keep their coffee makers running all day? We can do something similar with Lambda:
# Instead of this (cold kitchen):
def make_coffee(order):
coffee_maker = setup_coffee_maker() # Takes time!
return coffee_maker.brew(order)
# Do this (warm kitchen):
coffee_maker = setup_coffee_maker() # Done once when kitchen opens
def make_coffee(order):
return coffee_maker.brew(order) # Ready to go!
But what if you’re running a global restaurant chain? That brings us to our next challenge…
Lambda Layers as our shared kitchen pantry
Imagine if every kitchen in a restaurant chain had to stock its unique spices, sauces, and ingredients. That would be inefficient and expensive, right? This is where Lambda Layers come in, they’re like a shared pantry that all your kitchens can access.
Let me show you what I mean. Say you have this amazing secret sauce recipe that all your kitchens use:
# Without layers (every kitchen needs its own copy):
def make_secret_sauce():
import huge_sauce_recipe
return huge_sauce_recipe.cook()
# With layers (shared recipe book):
# The recipe is already available!
def make_secret_sauce():
return shared_recipes.secret_sauce.cook()
But here’s something most people don’t know about Lambda Layers: they’re not just copied to each function. AWS keeps them in a special high-speed storage area, kind of like having a central warehouse that can quickly deliver ingredients to any kitchen in your chain.
The global restaurant chain challenge
Now, let’s scale up our restaurant analogy. Imagine you’re running a global restaurant chain. You wouldn’t make customers in Tokyo wait for their order to be prepared in New York, would you? Of course not! You’d have local kitchens in different regions.
This is exactly what we do with multi-region Lambda deployments. But it’s not as simple as just opening new locations. You need to think about:
Menu consistency: How do you ensure all locations serve the same food (code consistency)?
Recipe updates: How do you update recipes across all locations (deployment)?
Ingredient availability: How do you handle local ingredients vs. imported ones (data synchronization)?
The clever part is how we handle “recipes” (our code) and “ingredients” (our data):
Recipes are synchronized across all regions using automated deployments
Common ingredients (shared data) are replicated globally
Local ingredients (regional data) stay in their region for faster access
The master chef’s secret to success
Remember our initial story about the struggling serverless application? Here’s how successful teams fix these problems:
They “pre-heat their kitchens” using smart cold start strategies
They organize their “ingredients” using Lambda Layers
They “open local kitchens” with multi-region deployment
The result? Their applications now serve users worldwide with the speed of a local diner and the consistency of a global chain.
Cloud kitchens and the road ahead
Just like how cloud kitchens are revolutionizing the restaurant industry, serverless computing is changing Just as cloud kitchens are reshaping the restaurant industry, serverless computing is redefining how we build and scale applications. AWS Lambda has become the centerpiece of this transformation, constantly evolving and adding new “appliances” to our serverless kitchen. Think of these as tools that make cooking faster, easier, and more efficient:
Faster startup times: Like an instant-heat stove that’s ready to go at the flick of a switch.
Better ingredient management: Enhanced layer handling, ensuring all your tools and recipes are perfectly organized and instantly accessible.
More efficient global distribution: Multi-region support that ensures your application is always close to your customers, no matter where they are.
But here’s the thing: a kitchen filled with gadgets isn’t necessarily a better kitchen. The true art lies in mastering the tools you have and knowing when and how to use them. The goal isn’t to clutter your workspace with every shiny new device; it’s to serve your customers the best possible experience with simplicity, speed, and reliability.
As serverless computing matures, the possibilities stretch as far as your imagination. Picture a world where your “kitchen” doesn’t just react to orders but anticipates them, spinning up resources before you even know you’ll need them. A world where applications self-optimize, dynamically adapting to demand like a master chef tweaking a recipe in real-time.
The journey isn’t about blindly chasing every new feature AWS releases. It’s about building a foundation of understanding, experimenting with confidence, and delivering value consistently. Whether you’re running a small diner or a global restaurant chain, the secret to success remains the same: focus on what your customers need and let the tools work their magic in the background.
AWS Lambda isn’t just a tool; it’s an opportunity. And as we step into this exciting future, the question isn’t, “What can Lambda do for me?” It’s, “What can I do with Lambda?”