I was staring at our AWS bill at two in the morning, nursing my third cup of coffee, when I realized something that should have been obvious months earlier. We were paying more to distribute our traffic than to process it. Our Application Load Balancer, that innocent-looking service that simply forwards packets from point A to point B, was consuming $3,900 every month. That is $46,800 a year. For a traffic cop. A very expensive traffic cop that could not even handle our peak loads without breaking into a sweat.
The particularly galling part was that we had accepted this as normal. Everyone uses AWS load balancers, right? They are the standard, the default, the path of least resistance. It is like paying rent for an apartment you only use to store your shoes. Technically functional, financially absurd.
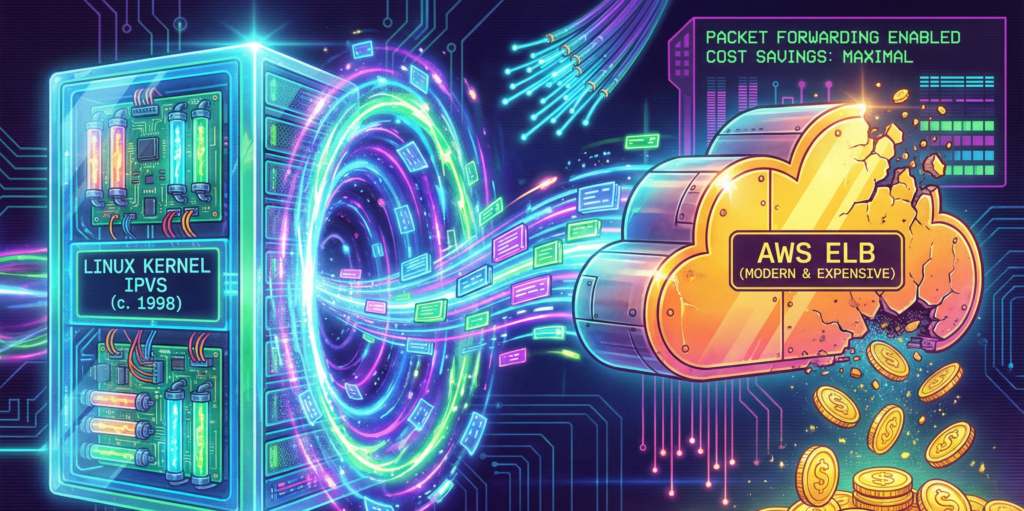
So we did what any reasonable engineering team would do at that hour. We started googling. And that is how we discovered IPVS, a technology so old that half our engineering team had not been born when it was first released. IPVS stands for IP Virtual Server, which sounds like something from a 1990s hacker movie, and honestly, that is not far off. It was written in 1998 by a fellow named Wensong Zhang, who presumably had no idea that twenty-eight years later, a group of bleary-eyed engineers would be using his code to save more than forty-six thousand dollars a year.
The expensive traffic cop
To understand why we were so eager to jettison our load balancer, you need to understand how AWS pricing works. Or rather, how it accumulates like barnacles on the hull of a ship, slowly dragging you down until you wonder why you are moving so slowly.
An Application Load Balancer costs $0.0225 per hour. That sounds reasonable, about sixteen dollars a month. But then there are LCUs, or Load Balancer Capacity Units, which charge you for every new connection, every rule evaluation, every processed byte. It is like buying a car and then discovering you have to pay extra every time you turn the steering wheel.
In practice, this meant our ALB was consuming fifteen to twenty percent of our entire infrastructure budget. Not for compute, not for storage, not for anything that actually creates value. Just for forwarding packets. It was the technological equivalent of paying a butler to hand you the remote control.
The ALB also had some architectural quirks that made us scratch our heads. It terminated TLS, which sounds helpful until you realize we were already terminating TLS at our ingress. So we were decrypting traffic, then re-encrypting it, then decrypting it again. It was like putting on a coat to go outside, then taking it off and putting on another identical coat, then finally going outside. The security theater was strong with this one.
A trip to 1999
I should confess that when we started this project, I had no idea what IPVS even stood for. I had heard it mentioned in passing by a colleague who used to work at a large Chinese tech company, where apparently everyone uses it. He described it with the kind of reverence usually reserved for vintage wine or classic cars. “It just works,” he said, which in engineering terms is the highest possible praise.
IPVS, I learned, lives inside the Linux kernel itself. Not in a container, not in a microservice, not in some cloud-managed abstraction. In the actual kernel. This means when a packet arrives at your server, the kernel looks at it, consults its internal routing table, and forwards it directly. No context switches, no user-space handoffs, no “let me ask my manager” delays. Just pure, elegant packet forwarding.
The first time I saw it in action, I felt something I had not felt in years of cloud engineering. I felt wonder. Here was code written when Bill Clinton was president, when the iPod was still three years away, when people used modems to connect to the internet. And it was outperforming a service that AWS charges thousands of dollars for. It was like discovering that your grandfather’s pocket watch keeps better time than your smartwatch.
How the magic happens
Our setup is almost embarrassingly simple. We run a DaemonSet called ipvs-router on dedicated, tiny nodes in each Availability Zone. Each pod does four things, and it does them with the kind of efficiency that makes you question everything else in your stack.
First, it claims an Elastic IP using kube-vip, a CNCF project that lets Kubernetes pods take ownership of spare EIPs. No AWS load balancer required. The pod simply announces “this IP is mine now”, and the network obliges. It feels almost rude how straightforward it is.
Second, it programs IPVS in the kernel. IPVS builds an L4 load-balancing table that forwards packets at line rate. No proxies, no user-space hops. The kernel becomes your load balancer, which is a bit like discovering your car engine can also make excellent toast. Unexpected, but delightful.
Third, it syncs with Kubernetes endpoints. A lightweight controller watches for new pods, and when one appears, IPVS adds it to the rotation in less than a hundred milliseconds. Scaling feels instantaneous because, well, it basically is.
But the real trick is the fourth thing. We use something called Direct Server Return, or DSR. Here is how it works. When a request comes in, it travels from the client to IPVS to the pod. But the response goes directly from the pod back to the client, bypassing the load balancer entirely. The load balancer never sees response traffic. That is how we get ten times the throughput. It is like having a traffic cop who only directs cars into the city but does not care how they leave.
The code that makes it work
Here is what our DaemonSet looks like. I have simplified it slightly for readability, but this is essentially what runs in our production cluster:
apiVersion: apps/v1
kind: DaemonSet
metadata:
  name: ipvs-router
  namespace: kube-system
spec:
  selector:
    matchLabels:
      app: ipvs-router
  template:
    metadata:
      labels:
        app: ipvs-router
    spec:
      hostNetwork: true
      containers:
      - name: ipvs-router
        image: ghcr.io/kube-vip/kube-vip:v0.8.0
        args:
        - manager
        env:
        - name: vip_arp
          value: ""true""
        - name: port
          value: ""443""
        - name: vip_interface
          value: eth0
        - name: vip_cidr
          value: ""32""
        - name: cp_enable
          value: ""true""
        - name: cp_namespace
          value: kube-system
        - name: svc_enable
          value: ""true""
        - name: vip_leaderelection
          value: ""true""
        securityContext:
          capabilities:
            add:
            - NET_ADMIN
            - NET_RAW
The key here is hostNetwork: true, which gives the pod direct access to the host’s network stack. Combined with the NET_ADMIN capability, this allows IPVS to manipulate the kernel’s routing tables directly. It requires a certain level of trust in your containers, but then again, so does running a load balancer in the first place.
We also use a custom controller to sync Kubernetes endpoints with IPVS. Here is the core logic:
# Simplified endpoint sync logic
def sync_endpoints(service_name, namespace):
    # Get current endpoints from Kubernetes
    endpoints = k8s_client.list_namespaced_endpoints(
        namespace=namespace,
        field_selector=f""metadata.name={service_name}""
    )

    # Extract pod IPs
    pod_ips = []
    for subset in endpoints.items[0].subsets:
        for address in subset.addresses:
            pod_ips.append(address.ip)

    # Build IPVS rules using ipvsadm
    for ip in pod_ips:
        subprocess.run([
            ""ipvsadm"", ""-a"", ""-t"",
            f""{VIP}:443"", ""-r"", f""{ip}:443"", ""-g""
        ])

    # The -g flag enables Direct Server Return (DSR)
    return len(pod_ips)
The numbers that matter
Let me tell you about the math, because the math is almost embarrassing for AWS. Our old ALB took about five milliseconds to set up a new connection. IPVS takes less than half a millisecond. That is not an improvement. That is a different category of existence. It is the difference between walking to the shops and being teleported there.
While our ALB would start getting nervous around one hundred thousand concurrent connections, IPVS just does not. It could handle millions. The only limit is how much memory your kernel has, which in our case meant we could have hosted the entire internet circa 2003 without breaking a sweat.
In terms of throughput, our ALB topped out around 2.5 gigabits per second. IPVS saturates the 25-gigabit NIC on our c7g.medium instances. That is ten times the throughput, for those keeping score at home. The load balancer stopped being the bottleneck, which was refreshing because previously it had been like trying to fill a swimming pool through a drinking straw.
But the real kicker is the cost. Here is the breakdown. We run one c7g.medium spot instance per availability zone, three zones total. Each costs about $0.017 per hour. That is $0.051 per hour for compute. We also have three Elastic IPs at $0.005 per hour each, which is $0.015 per hour. With Direct Server Return, outbound transfer costs are effectively zero because responses bypass the load balancer entirely.
The total? A mere $0.066 per hour. Divide that among three availability zones, and you’re looking at roughly $0.009 per hour per zone. That’s nine-tenths of a cent per hour. Let’s not call it optimization, let’s call it a financial exorcism. We went from shelling out $3,900 a month to a modest $48. The savings alone could probably afford a very capable engineer’s caffeine habit.
But what about L7 routing
At this point, you might be raising a valid objection. IPVS is dumb L4. It does not inspect HTTP headers, it does not route based on gRPC metadata, and it does not care about your carefully crafted REST API conventions. It just forwards packets based on IP and port. It is the postal worker of the networking world. Reliable, fast, and utterly indifferent to what is in the envelope.
This is where we layer in Envoy, because intelligence should live where it makes sense. Here is how the request flow works. A client connects to one of our Elastic IPs. IPVS forwards that connection to a random healthy pod. Inside that pod, an Envoy sidecar inspects the HTTP/2 headers or gRPC metadata and routes to the correct internal service.
The result is L4 performance at the edge and L7 intelligence at the pod. We get the speed of kernel-level packet forwarding combined with the flexibility of modern service mesh routing. It is like having a Formula 1 engine in a car that also has comfortable seats and a good sound system. Best of both worlds. Our Envoy configuration looks something like this:
static_resources:
  listeners:
  - name: ingress_listener
    address:
      socket_address:
        address: 0.0.0.0
        port_value: 443
    filter_chains:
    - filters:
      - name: envoy.filters.network.http_connection_manager
        typed_config:
          ""@type"": type.googleapis.com/envoy.extensions.filters.network.http_connection_manager.v3.HttpConnectionManager
          stat_prefix: ingress
          route_config:
            name: local_route
            virtual_hosts:
            - name: api
              domains:
              - ""api.ourcompany.com""
              routes:
              - match:
                  prefix: ""/v1/users""
                route:
                  cluster: user_service
              - match:
                  prefix: ""/v1/orders""
                route:
                  cluster: order_service
          http_filters:
          - name: envoy.filters.http.router
            typed_config:
              ""@type"": type.googleapis.com/envoy.extensions.filters.http.router.v3.Router
The afternoon we broke everything
I should mention that our first attempt did not go smoothly. In fact, it went so poorly that we briefly considered pretending the whole thing had never happened and going back to our expensive ALBs.
The problem was DNS. We pointed our api.ourcompany.com domain at the new Elastic IPs, and then we waited. And waited. And nothing happened. Traffic was still going to the old ALB. It turned out that our DNS provider had a TTL of one hour, which meant that even after we updated the record, most clients were still using the old IP address for, well, an hour.
But that was not the real problem. The real problem was that we had forgotten to update our health checks. Our monitoring system was still pinging the old ALB’s health endpoint, which was now returning 404s because we had deleted the target group. So our alerts were going off, our pagers were buzzing, and our on-call engineer was having what I can only describe as a difficult afternoon.
We fixed it, of course. Updated the health checks, waited for DNS to propagate, and watched as traffic slowly shifted to the new setup. But for about thirty minutes, we were flying blind, which is not a feeling I recommend to anyone who values their peace of mind.
Deploying this yourself
If you are thinking about trying this yourself, the good news is that it is surprisingly straightforward. The bad news is that you will need to know your way around Kubernetes and be comfortable with the idea of pods manipulating kernel networking tables. If that sounds terrifying, perhaps stick with your ALB. It is expensive, but it is someone else’s problem.
Here is the deployment process in a nutshell. First, deploy the DaemonSet. Then allocate some spare Elastic IPs in your subnet. There is a particular quirk in AWS networking that can ruin your afternoon: the source/destination check. By default, EC2 instances are configured to reject traffic that does not match their assigned IP address. Since our setup explicitly relies on handling traffic for IP addresses that the instance does not technically ‘own’ (our Virtual IPs), AWS treats this as suspicious activity and drops the packets. You must disable the source/destination check on any instance running these router pods. It is a simple checkbox in the console, but forgetting it is the difference between a working load balancer and a black hole.
The pods will auto-claim them using kube-vip. Also, ensure your worker node IAM roles have permission to reassociate Elastic IPs, or your pods will shout into the void without anyone listening. Update your DNS to point at the new IPs, using latency-based routing if you want to be fancy. Then watch as your ALB target group drains, and delete the ALB next week after you are confident everything is working.
The whole setup takes about three hours the first time, and maybe thirty minutes if you do it again. Three hours of work for $46,000 per year in savings. That is $15,000 per hour, which is not a bad rate by anyone’s standards.
What we learned about Cloud computing
Three months after we made the switch, I found myself at an AWS conference, listening to a presentation about their newest managed load balancing service. It was impressive, all machine learning and auto-scaling and intelligent routing. It was also, I calculated quietly, about four hundred times more expensive than our little IPVS setup.
I did not say anything. Some lessons are better learned the hard way. And as I sat there, sipping my overpriced conference coffee, I could not help but smile.
AWS managed services are built for speed of adoption and lowest-common-denominator use cases. They are not built for peak efficiency, extreme performance, or cost discipline. For foundational infrastructure like load balancing, a little DIY unlocks exponential gains.
The embarrassing truth is that we should have done this years ago. We were so accustomed to reaching for managed services that we never stopped to ask whether we actually needed them. It took a 2 AM coffee-fueled bill review to make us question the assumptions we had been carrying around.
Sometimes the future of cloud computing looks a lot like 1999. And honestly, that is exactly what makes it beautiful. There is something deeply satisfying about discovering that the solution to your expensive modern problem was solved decades ago by someone working on a much simpler internet, with much simpler tools, and probably much more sleep.
Wensong Zhang, wherever you are, thank you. Your code from 1998 is still making engineers happy in 2026. That is not a bad legacy for any piece of software.
The author would like to thank his patient colleagues who did not complain (much) during the DNS propagation incident, and the kube-vip maintainers who answered his increasingly desperate questions on Slack.