Writing code is a clean, almost intellectual pursuit. You sit in a quiet room, sip your beverage of choice, and arrange logic into a beautiful digital tapestry. If you do your job well, the application works perfectly on your laptop. But then comes the moment when you must share your creation with the rest of the world. This is where the poetry ends, and the manual labor begins.
Suddenly, you are no longer a software creator. You are an amateur construction worker trying to pave a highway while driving on it. You find yourself wrestling with security configurations, arguing with network routing protocols, and praying that your cloud deployment pipelines do not collapse under the weight of a single misplaced space in a configuration file. For many developers, managing the cloud feels like buying a brand-new television, only to discover that you have to personally run copper wire to the local power plant just to turn it on.
While looking into how modern cloud infrastructure operates, I spent some time investigating AWS Proton. The philosophy behind this service is fascinating because it tackles one of the oldest, most polite cold wars in the history of office environments, the constant struggle between the people who build software and the people who keep the servers from catching fire.
The high cost of giving matches to creative people
When a software company is small, cloud infrastructure is a domestic affair. You might have two developers and a single cloud account. If someone needs to deploy a new feature, they simply log in, click a few buttons in a console, and hope for the best. It is chaotic, but it is a cozy kind of chaos.
Once a company grows, however, teams multiply. If you leave developers to their own devices without any central coordination, they will inevitably invent their own highly creative, deeply eccentric ways to deploy their code.
One team might rely on custom scripts that only run on a specific laptop currently sitting under a coffee-stained desk. Another team might build a labyrinth of configuration files that are so complex they resemble ancient runic spells. A third team might simply copy and paste outdated templates they found on an internet forum, hoping that nobody notices the glaring security vulnerabilities hidden inside.
Before you know it, your corporate cloud architecture looks less like a modern facility and more like a crowded public pool where nobody is paying attention to the lifeguards. The challenge is no longer about writing good code. It is about preventing the sheer variety of deployment methods from driving your operations team to physical and emotional exhaustion.
Dividing the kitchen between the chefs and the safety inspectors
This is where AWS Proton enters the room, holding a clipboard and looking very serious. The easiest way to understand the service is to look at how a professional restaurant kitchen operates.
If you let every line cook design their own stove, choose their own gas pressures, and source their own fire extinguishers, the restaurant will burn down before the first appetizer is served. Instead, a master chef designs the kitchen layout once, sets up the safety parameters, and ensures the prep stations are stocked. The line cooks can then focus entirely on cooking the food without having to worry about plumbing or municipal gas lines.
AWS Proton does exactly this for cloud deployments by separating your engineering department into two distinct, cooperative camps.
The platform engineers act as the safety inspectors. They define the corporate standards, write the reusable infrastructure templates, and establish secure delivery pipelines. They build a safe sandbox with very tall, very soft walls.
The developers act as the creative chefs. Instead of writing custom deployment configurations from scratch, they simply log into a self-service portal, select an approved template, and deploy their applications. They do not have to know how the network routing works under the hood. They just need to know that their code has a safe place to run.
The magic of filling out a form without crying
To see how this works in practice, we can look at what this separation actually looks like on a file level.
First, the platform team defines what a standard, secure service should look like. They write a schema file using YAML, which is the industry-standard language for telling computers how to build virtual networks.
Here is a simplified example of what a platform engineer might write to define an environment template:
schema:
  format:
    version: "1"
proton: EnvironmentTemplate
index:
  name: "secure-ecs-fargate-environment"
  version: "1.0"
  description: "A standard environment with sensible defaults so nobody accidentally exposes our database to the open internet"
This template is stored centrally in AWS Proton. It acts as an official blueprint.
When a developer wants to deploy a new microservice, they do not need to read through hundreds of lines of infrastructure code. They do not need to learn how to configure an AWS load balancer. Instead, they write a very simple specification file that only asks them for the details that actually matter to their application.
Here is what the developer’s configuration file looks like:
The developer only has to specify the basic dimensions of their application, such as how much memory it needs and which port it uses. AWS Proton takes this small file, combines it with the platform team’s secure blueprint, and builds the entire system automatically. The developer gets their application deployed in minutes, and the platform team can sleep at night knowing that nobody used insecure settings.
The industrialization of the digital assembly line
If you are just learning the basics of cloud computing or building a personal website to display pictures of your cat, AWS Proton is almost certainly more tool than you need. It is the industrial equivalent of buying a commercial cement mixer to repair a crack in your driveway.
But if you look at where the wider technology industry is heading, services like AWS Proton represent a massive cultural shift. For the past decade, the industry told developers that they needed to know everything. They were told to write the code, configure the networks, manage the databases, and monitor the security alerts. We called this DevOps, and while the intentions were noble, it often resulted in highly skilled programmers spending half their week acting as frustrated system administrators.
Companies are starting to realize that cognitive overload is real. If you force a developer to become an expert in cloud networking, they will have less energy to spend on making your product actually work.
The rise of platform engineering is a quiet admission that we need specialists. We need people who are incredibly good at building secure, stable platforms, and we need to let everyone else use those platforms without having to understand the underlying physics of the cloud.
Some parting thoughts on staying warm without catching fire
The more you look at modern cloud architectures, the more you realize that the hardest problems are rarely technical. Computers will almost always do exactly what we tell them to do, provided we format our instructions correctly. The real friction exists in the human systems we build around those computers.
AWS Proton is an attempt to reduce that human friction. By turning infrastructure into a collaborative, template-driven system, it allows different teams to work together without constantly stepping on each other’s toes.
If you are currently studying cloud technologies or preparing for a career in platform engineering, understanding these patterns is incredibly valuable. The future of software development is not about making systems more complex. It is about building elegant interfaces that keep us from burning down the very things we are trying to build.
There is a particular kind of optimism that appears in architecture diagrams. It is usually represented by a neat rectangle labelled “sandbox”, placed between “user code” and “production systems”, as if malicious input could be discouraged by tidy geometry.
For years, we have treated this rectangle with a level of trust usually reserved for elevators, bridges, and the one person in the meeting who says, “This should be simple.” Inside the box went user scripts, notebook cells, plugin code, CI jobs, vulnerability scanners, browser IDE sessions and, more recently, AI agents with the confidence of a junior developer and the impulse control of a caffeinated raccoon.
The problem was never running code. Computers are embarrassingly eager to do that. The problem was trusting the code not to bite the furniture.
AWS Lambda MicroVMs are interesting because they arrive at the exact moment when everyone is trying to run more untrusted code, more often, with fewer humans staring nervously at terminal output. They are not just another Lambda feature wearing a party hat. They are AWS trying to give each user, job, or agentic session its own small, isolated room, complete with VM-level walls, preserved state, and a serverless landlord who handles the plumbing.
That is worth paying attention to.
The old sandbox had suspicious drywall
Containers made modern platform engineering possible. They package applications beautifully, start quickly and behave well enough that we have built entire civilizations on top of them, some of which even survive Monday mornings.
But containers share the host kernel. That is not a moral failure. It is simply the bargain. You get speed and density, but the isolation boundary is not the same as a virtual machine boundary. For normal workloads, this is often a perfectly reasonable trade. For hostile or unknown code, it becomes a slightly more awkward dinner party.
Running untrusted code in containers usually requires extra hardening. Seccomp profiles, AppArmor or SELinux policies, rootless runtimes, careful filesystem restrictions, capability dropping, network controls, resource limits, image hygiene, and a collection of internal documents with titles like “please do not run customer code as root again”.
This does not mean containers are bad. It means they have spent years being asked to babysit workloads they would probably rather not meet in a dark data center.
Virtual machines have always had a stronger answer. Each workload gets a separate kernel and a more substantial isolation boundary. Security teams like that sort of thing. They sleep better when the boundary is not made entirely of namespace optimism.
The problem is that traditional VMs are heavier. They take longer to boot, require more lifecycle management and make interactive platforms feel like they are starting a small moon every time someone clicks “run”. If you are building a browser IDE, a notebook platform, or an AI coding assistant, waiting minutes for an execution environment is not a product experience. It is a hostage situation with a spinner.
So teams built their own sandboxes. Some used hardened containers. Some orchestrated pools of VMs. Some built elaborate custom schedulers. Many discovered that safely running other people’s code is less a feature and more a lifestyle choice involving pager alerts.
Firecracker was already doing the quiet work
The interesting part is that AWS already had a lightweight virtualization story hiding in plain sight. Firecracker has powered Lambda and Fargate-style isolation patterns for years. It was designed to provide lightweight MicroVMs with fast startup and strong boundaries, without dragging the full emotional luggage of traditional VM management into every request.
Lambda MicroVMs take that idea and expose it as a managed primitive for a very specific class of applications. These are not ordinary Lambda functions that got promoted. They are separate resources with a distinct lifecycle and a different purpose.
Regular Lambda functions are still excellent for event-driven work. A request arrives, a function runs, a result returns, and the function disappears back into the mist like a responsible woodland creature. That model works beautifully for stateless tasks.
Lambda MicroVMs are for the messier cases. A user opens an interactive coding environment. An AI agent needs to inspect files, run code, call tools, and maintain context. A data analytics session installs packages, loads working files, and waits while the human operator goes to lunch, a meeting, or an unexpected argument with Kubernetes.
These sessions need state. They need isolation. They need to start quickly. They need to pause without losing their belongings.
That combination used to be annoying. Now it has a first-class shape.
Lambda functions answer the doorbell, MicroVMs let the guest stay
The lifecycle is the real story.
You create a MicroVM image from a Dockerfile and a code artifact. AWS initializes the environment and captures a Firecracker snapshot of disk and memory. Later, when you launch a MicroVM from that image, it starts from the pre-initialized snapshot instead of beginning from scratch.
This is the difference between cooking dinner from raw ingredients and reheating yesterday’s lasagna. One is noble. The other is faster and, under the correct emotional conditions, superior.
Snapshots matter because many interactive environments spend a surprising amount of time getting ready to do the thing the user actually asked for. Installing packages, loading runtimes, preparing tools, arranging directories, initializing services, warming models, importing dependencies, and opening files. All of this can become part of the prepared environment.
For AI agents, this is especially useful. The environment can already contain the tools, SDKs, interpreters, and supporting processes the agent needs. When a session starts or resumes, it does not have to assemble itself from a cold and resentful universe.
There is a catch, because distributed systems are legally required to have at least one. Snapshotting state means engineers must think carefully about what is safe to preserve and clone. Unique identifiers, network connections, ephemeral credentials, time-sensitive tokens, and initialization-time randomness may all need special handling.
A snapshot is not just a performance trick. It is a memory of a machine. And memories, as anyone who has debugged a stale cache knows, can lie with great confidence.
Eight hours change the serverless conversation
The 8-hour runtime limit is one of the details that make this more than a faster function wrapper.
Traditional serverless thinking has usually pushed us toward short, stateless execution. Do a job, return a result, vanish. This is clean, scalable, and architecturally pleasing, which means real users immediately invent workflows that do not fit it.
Interactive sessions are not short. Vulnerability scans can run for a while. Data analysis can wander. AI agents can start with “inspect this repository” and somehow end up creating four temporary files, two package installs, and a philosophical dispute with a linter.
Lambda MicroVMs support longer-running sessions while preserving memory, disk, and process state. During idle periods, the environment can be suspended and later resumed. That matters because many workloads are not constantly busy. Humans pause. Agents wait. Browsers sleep. Developers get pulled into meetings where someone says “alignment” until the will to compute leaves the room.
Idle suspension changes the economics and the experience. The user can return to a session that still has its working state, but the platform does not have to pay as if the machine were actively sweating the entire time.
This is still serverless, but not the old cartoon version where everything is tiny, stateless, and over before the coffee cools. It is serverless with a memory.
That sentence would have terrified architects ten years ago. Now it may be exactly what agent platforms need.
AI agents need walls, not vibes
Agentic AI has made sandboxing fashionable in the same way kitchen fires make extinguishers fashionable.
An AI agent can generate code, run commands, inspect files, call APIs, and modify state. Sometimes it does this brilliantly. Sometimes it does this like a raccoon found a shell prompt and decided to modernize procurement.
The security model for agents must assume mistakes. It must assume prompt injection. It must assume unexpected tool use. It must assume that the agent is not evil, just helpful in the way a toddler with admin privileges might be helpful.
This is where per-user or per-session MicroVM isolation becomes important. If each agent run gets its own dedicated execution environment, the blast radius becomes easier to reason about. One confused agent should not be able to interfere with another user’s session. One malicious script should not get a friendly wave from a shared kernel and an invitation to explore the neighborhood.
But this is not magic safety dust. VM-level isolation is a stronger primitive, not a complete architecture.
You still need tight IAM roles. You still need network egress controls. You still need to decide whether the MicroVM can reach the internet, internal APIs, metadata services, package repositories or that one ancient endpoint nobody admits owns the business process. You still need secrets management, audit trails, logging, quotas, timeouts and cleanup.
The agent may now have its own padded serverless studio. You still need to check what tools you left in the drawers.
The security story is better, but not finished
The most dangerous sentence in cloud security is “the service handles that”.
Sometimes the service does handle that. Sometimes it handles one very important layer, and everything around it remains your problem, wearing a fake moustache.
Lambda MicroVMs improve the isolation layer. A dedicated MicroVM with no shared kernel between users is a meaningful architectural improvement for untrusted execution. It gives platform teams a stronger foundation than a basic container sandbox. It also reduces the amount of custom virtualization machinery teams need to build themselves.
But the surrounding design still decides whether the result is secure or just expensive theater.
Before production, architects should ask some unfashionable questions.
What can the MicroVM reach on the network?
What credentials exist inside the environment?
Can the workload call internal APIs?
Can it download arbitrary packages?
How is user code authenticated before execution?
How are sessions terminated?
What happens to files after suspension?
What gets written to logs?
How are snapshots built, versioned, and retired?
How are malicious or runaway workloads detected?
What prevents one customer from turning your lovely sandbox platform into a cryptocurrency-themed space heater?
These questions are not reasons to avoid the service. These are the reasons to use it properly. The stronger the primitive, the more tempting it is to stop thinking. Resist this. Architecture diagrams are very good at looking innocent.
The bill is also part of the architecture
Serverless has trained us to associate managed services with financial elegance. Sometimes this is true. Sometimes the invoice arrives carrying a clipboard and asking to speak with the adult who designed the retry policy.
Lambda MicroVMs have a cost model that deserves actual modeling. You pay for baseline resources while a MicroVM is running, and for additional active usage when the workload exceeds that baseline. That is reasonable, but it means usage patterns matter.
A short-lived scan that starts, does work, and terminates has one shape. An interactive coding session that runs, idles, suspends, resumes, and idles again has another. A swarm of AI agents that each receive their own environment has a third shape, one that may require finance to breathe into a paper bag if nobody adds quotas.
The point is not that this will be expensive. The point is that “serverless” does not automatically mean “cheap”. It means the operational model changes. Billing still obeys physics, usage, and the quiet vengeance of concurrency.
If you are building a platform on top of Lambda MicroVMs, model the boring details. Average session duration. Idle time. Resume frequency. Memory size. CPU requirements. Disk usage. Regional availability. Expected concurrency. Abuse scenarios. Free-tier fantasies, if your product team has recently been exposed to those.
Cloud bills are where optimistic architecture diagrams go to receive adult supervision.
Platform engineering gets a new building block
For platform teams, the most promising part of Lambda MicroVMs is not that they make one workload easier. It is that they could simplify a recurring pattern.
Many organizations need a safe way to run untrusted or semi-trusted code. Internal developer platforms need execution sandboxes. AI products need agent workspaces. Security platforms need isolated scanning environments. Data platforms need notebook-like sessions. Education platforms need per-student runtimes. CI systems need disposable workers.
Historically, building this well meant assembling a small private cloud inside your cloud. VM pools, schedulers, cleanup jobs, image builders, network isolation, capacity management, logging pipelines, and emergency scripts named things like final_cleanup_v7_really_final.sh.
Lambda MicroVMs do not remove all platform work. They move the boundary.
You still need golden images. You still need lifecycle policies. You still need guardrails. You still need quotas and tenant mapping. You still need observability. You still need deployment pipelines. You still need to decide how MicroVMs integrate with Lambda functions, S3, CloudWatch, IAM, and whatever control plane runs your product.
But you may not need to own as much of the virtualization substrate yourself. That is not glamorous. It is better. Glamour is what vendors put in keynote slides before someone asks about day two operations.
A sensible pattern might use regular Lambda functions for the event-driven control plane, APIs, and orchestration logic. Lambda MicroVMs handle the isolated execution path, where user code or AI-generated code actually runs. S3 stores build artifacts. CloudWatch captures logs. IAM defines what each environment can do. Network controls define what each environment can reach.
That division feels clean. Not simple, because nothing involving untrusted code is simple. But clean enough to be useful.
The uncomfortable production checklist
Before adopting Lambda MicroVMs, it is worth being deliberately boring. Boring is underrated in architecture. Boring systems sleep through the night.
Ask which workloads actually need VM-level isolation. Some do. Some are perfectly fine as regular Lambda functions, ECS tasks, or containers in Kubernetes. Using a stronger primitive everywhere can become expensive and operationally awkward.
Ask how long sessions really run. Not how long the demo runs. Not how long the product manager hopes they run. How long do users actually keep them alive while opening seven browser tabs and going to lunch?
Ask what state must survive suspension. Then ask what state must never survive suspension. Secrets, temporary credentials, one-time tokens, and sensitive intermediate files need careful treatment.
Ask how images are built and patched. A MicroVM image is still software. It needs supply chain controls, vulnerability scanning, versioning, and retirement. Yesterday’s golden image can become tomorrow’s antique security incident.
Ask what happens when a workload wants more. More CPU. More memory. More disk. GPU acceleration. x86 compatibility. A different region. A longer session. Some requests will fit the service. Some will not. That is not a failure. That is architecture doing its job before production does it for you with alarms.
Ask how abuse is stopped. Per-user quotas, concurrency limits, session expiration, network restrictions, and cost controls should be designed early. Waiting until after the first runaway agent is a traditional learning method, but not a relaxing one.
A better sandbox is not a finished safety plan
Lambda MicroVMs arrive at a useful moment. The industry is asking applications to execute more code that the application developer did not write. Some of that code comes from users. Some comes from AI systems. Some comes from a collaboration between both, which is how you get an incident report with a surprisingly emotional timeline.
The old choices were uncomfortable. Containers were fast but needed serious hardening for hostile workloads. Traditional VMs were safer but heavy. Regular serverless functions were elegant but not designed for long, stateful, interactive sessions.
Lambda MicroVMs offer a new middle ground. VM-level isolation. Fast launch and resume from snapshots. Stateful sessions. Idle suspension. Serverless lifecycle management. A dedicated environment per user, job, or agentic session.
That combination will not remove the need for security architecture. It will not absolve anyone from IAM, networking, secrets, observability, patching, or cost controls. It will not make AI agents safe by virtue of being placed inside a branded rectangle.
But it gives the sandbox real walls.
And that matters. Because the sandbox did not become safer because someone wrote “AI” on the diagram. It became safer because the walls got real.
Somewhere along the way, multi cloud stopped being an architecture decision and became a personality trait. It shows up on slide decks the way kale shows up at weddings, nobody is quite sure who asked for it, but removing it now would feel like a confession. Say the words out loud in a meeting and watch the room nod with the solemn confidence of people who have read the headline but not the footnotes.
The pitch is seductive. Spread your workloads across two or three providers and you get freedom, resilience, and a vague aura of technical adulthood. What you actually get, in a surprising number of cases, is a second pager rotation and a networking bill that reads like a ransom note.
This is not an argument that multi cloud is always wrong. It is an argument that it is rarely the default answer to a question nobody bothered to ask. A lot of cloud decisions get made the way people buy treadmills, for the version of themselves they intend to become, not the one currently standing in the room.
What the multi cloud pitch is really selling
Strip away the architecture diagrams, and the multi cloud sales pitch is mostly emotional. It promises escape from vendor lock in, that primal fear of being trapped by a provider who knows it. It offers the warm feeling of resilience, the sense that if one cloud falls over, your business will calmly stroll to the next one. And it projects maturity, the impression that your team has graduated from amateur hour to serious infrastructure people.
These are real desires. The problem is that multi cloud answers them roughly the way buying a second house answers your fear of a leaky roof. Technically, you now have options. You also have two roofs.
Where the trouble starts
The fantasy version of multi cloud assumes a clean layer of abstraction sitting neatly on top of every provider, so your team writes once and runs anywhere. The practical version is that each cloud is its own country, with its own language, customs, and bewildering opinions about what a load balancer should be called.
Total abstraction almost never survives contact with production. Your engineers do not get to learn one platform deeply. They get to learn two platforms simultaneously, plus the seam between them, which is where the genuinely interesting bugs live. The architecture becomes harder to document, harder to operate, and harder to evolve, which is a polite way of saying nobody on the team fully understands all of it anymore, including the person who built it.
The costs nobody put on the slide
Here is where the war story usually turns grim. The expensive part of multi cloud is rarely the compute. It is everything wrapped around it.
You duplicate your observability stack, because the dashboards that work beautifully in one cloud are politely useless in the other. Your IAM and governance model doubles in surface area, since every permission, role, and policy now needs a twin that behaves identically and never quite does. Network egress, cross cloud replication, and data transfer charges accumulate quietly in the background like a subscription you forgot to cancel.
And then there is the human cost, which never appears in the cost calculator. Multi cloud raises the seniority floor of your entire team. The junior engineer who could safely ship in a single, well governed environment now needs to understand two of everything before they can be trusted near production. You do not just pay for more infrastructure. You pay for more expertise to keep that infrastructure from quietly drifting apart.
Security and compliance, now in stereo
Security people have a particular look they get when you mention multi cloud, the expression of someone who has been asked to childproof two houses for the price of one.
Every additional cloud is another attack surface, another set of policies to keep synchronized, and another generous opportunity for a misconfiguration to go unnoticed. Auditing becomes an exercise in translation, because a control that means one thing in the first provider means something subtly different in the second. The realistic end state is not airtight redundancy. It is an uneven security posture, strong where your team has invested attention and quietly soft where they ran out of hours.
Operations and the art of the unsolvable incident
Incidents are where multi cloud presents its invoice. At three in the morning, when something is on fire, you do not want your logs, metrics, and traces scattered across two providers like a crime scene split between jurisdictions.
Correlating an incident across clouds is slow, and slow is expensive when customers are watching. Mean time to detection creeps up. Mean time to resolution creeps up with it. Postmortems acquire an extra paragraph that always begins with some variation of “we lost time understanding which cloud was actually responsible.” To stitch the picture back together, you end up leaning on yet another external platform whose only job is to make your two clouds look like one, which, if you squint, is a strange amount of effort to undo a decision you made on purpose.
Portability you have versus portability you imagine
The intellectual cornerstone of multi cloud is portability, the comforting belief that you could pack up and move providers whenever you liked. In practice, portability tends to be the gym membership of architecture, fully paid for, rarely used, and quietly aspirational.
Most systems end up leaning on provider specific services anyway, because those services are good and saying no to them on principle is a luxury few teams can afford. Kubernetes and containers genuinely help, they smooth the edges, but they do not magically erase the dependency underneath. Real migrations are still slow, still costly, and still the kind of project that gets proposed with enthusiasm and abandoned with relief.
The honest goal is not total independence. It is a reasonable exit, an architecture where leaving would be painful but possible, rather than one where leaving is theoretically free and practically unthinkable. Designing for a sensible escape route beats promising a freedom you will never exercise.
When multi cloud actually earns its keep
None of this means multi cloud is a mistake. It means it is a tool with a narrow, legitimate set of jobs, and it deserves to be used for those rather than worn as a badge.
It earns its place when regulation or data sovereignty leaves you no choice, when the data legally must live in particular places. It makes sense when your organization is large enough that real negotiating leverage over providers translates into serious money. It is justified when the business risk is so high that genuine cross cloud redundancy is worth its considerable price. It is reasonable when a specific service on another cloud offers an advantage you cannot replicate elsewhere. And it works, crucially, only when the organization is mature enough to operate it, with the teams, processes, and discipline already in place rather than hopefully on order.
Notice that every one of these starts with a concrete business reason, not a vibe.
What I would do instead
If you handed me a blank slate and a reasonable budget, I would pick one primary cloud and govern it properly, because a single environment run well beats two environments run anxiously almost every time.
I would design for enough portability to sleep at night, not for the fantasy of frictionless migration. I would automate deployments and infrastructure from day one, before the shortcuts calcify into tradition. I would standardize observability, security, and cost management so the whole thing stays legible to the people who did not build it. And I would revisit the single cloud decision on a schedule, honestly, looking for a real reason to expand rather than a fashionable one.
That last part matters. The goal is not loyalty to one provider. It is refusing to add a second one until something other than anxiety is asking for it.
The question worth asking
Multi cloud can be genuinely useful. It just should not be the reflex, the thing you reach for because the alternative feels insufficiently ambitious. Far too often, what gets sold as strategy is simply complexity wearing a nicer outfit.
Cloud maturity is not measured in the number of providers on your invoice. It is measured by how well you use the one you actually need. The most sophisticated architecture in the room is frequently the one that resisted the urge to be impressive.
So the question is not how many clouds you run. It is whether each one earns its place.
There is a special kind of grief reserved for infrastructure that works fine. Nobody writes eulogies for the broken stuff; that gets deleted with enthusiasm. The painful goodbyes are for the things that still do their job every day, quietly, while the rest of the industry has already decided they belong in a museum. Your Ingress resources are in that category now. They route traffic, they terminate TLS, and they have not paged you in months. And they are, officially and by design, a dead end.
The Kubernetes project has been remarkably polite about this. Ingress is “frozen”, which is the standards body equivalent of moving someone to a nice farm upstate. No new features, no spec evolution, no fixes for the design decisions everyone now regrets. The replacement is called Gateway API, it reached general availability back in 2023, and it is one of those rare cases where the new thing is not just the old thing with more YAML. It actually fixes the organizational problem that made Ingress miserable, which, as we will see, was never really a technical problem at all.
The Ingress spec was always a rough draft
Here is the part of the story that usually gets left out. When Ingress shipped in 2015, the Kubernetes maintainers did not believe they had solved HTTP routing. They believed, correctly, that they had no idea what HTTP routing should look like, and they shipped a minimal spec on purpose. Host, path, backend service. That was essentially it. Everything else, the maintainers figured, could be handled by annotations until the community figured out what it actually wanted.
The community figured out what it wanted, all right. It wanted everything, and it wanted it via annotations.
If you have ever operated an nginx ingress controller in production, you know the genre. nginx.ingress.kubernetes.io/rewrite-target. nginx.ingress.kubernetes.io/canary-weight. nginx.ingress.kubernetes.io/configuration-snippet, which is the annotation equivalent of a hole in the wall that you push raw nginx config through and hope for the best. Traefik grew its own dialect. HAProxy grew another. At some point, the nginx controller alone supported well over a hundred proprietary annotations, each one a small confession that the spec underneath could not do the job.
The practical consequence is one that every platform engineer has lived. Your routing configuration is portable in theory and welded to your controller in practice. Migrating from nginx to anything else means translating a folklore of annotations by hand, and some of them have no translation, because they were never features of Kubernetes. They were features of one specific reverse proxy, smuggled in through a string field.
None of this makes Ingress bad design. It makes Ingress an honest admission, in 2015, that nobody agreed on what routing should look like. Gateway API is what happened after roughly eight years of arguing, when they finally agreed.
Three resources instead of one, and that is the whole upgrade
Gateway API replaces the single Ingress object with three, and before your YAML fatigue kicks in, stay with me, because the count is not the point. The ownership is.
GatewayClass is the template. It declares what kind of gateway infrastructure your cluster offers (Envoy, Cilium, or a cloud load balancer), and it gets written approximately once, by whoever runs the platform, and then mostly forgotten.
Gateway is a running instance of that template. It is the actual listener, the thing with an IP address and open ports, and it lives in an infrastructure namespace where application developers cannot poke it.
HTTPRoute is the routing rule. It says “traffic for this hostname and this path goes to this service”, and it lives in the application’s own namespace, right next to the Deployment it serves, owned by the team that owns the app.
That is the entire model. Three objects, three different owners, three different namespaces if you want them. Every interesting thing about Gateway API follows from that separation, which brings us to the actual argument.
The hallway belongs to the platform team, and the door belongs to the app team
Think about what an Ingress object actually is, organizationally. It is one resource that contains both infrastructure concerns (TLS certificates, load balancer behavior, controller tuning) and application concerns (which path goes to which service). One object, two very different audiences, and Kubernetes RBAC can only draw permission lines around whole objects.
So every organization running Ingress at scale ends up choosing between two bad options. Option one, the platform team owns all Ingress resources, and application teams file tickets to change a path rule, which is a magnificent way to turn a thirty-second change into a three-day wait. Option two, application teams own their Ingress resources, which means application teams can now set controller-level annotations, and somewhere in your cluster, there is a configuration snippet written by an intern in 2022 that nobody dares to remove. Both options are workarounds for the same flaw. The spec crammed two jobs into one object, and org charts do not bend that way.
Gateway API splits the object along exactly the line where your teams already split. The platform engineer provisions the Gateway in the infra namespace. They decide which ports are open, which TLS policy applies, and, crucially, which namespaces are allowed to attach routes to it. The application developer writes an HTTPRoute in their own namespace that says, in effect, “attach me to the gateway named external-web”. The route references the gateway by name; the gateway grants permission by policy. Cross-namespace routing is not a hack here, it is the core mechanic of the spec, with an explicit handshake on both sides.
If you read my past RBAC article, this will feel familiar, because it is the same principle wearing a different hat. Least privilege stopped being just about who can “kubectl delete” things and started applying to the network path itself. App teams get exactly the surface they need (their routes, their namespace) and nothing else. The platform team stops being a ticket-processing bottleneck and goes back to doing platform work. Nobody negotiates over annotations in a Slack thread at 6 p.m. on a Friday, which I am told does wonders for retention.
There is also a quieter benefit that only shows up in the postmortem. When routing rules live next to the application, the blast radius of a bad change is the application. When everything lives in one shared Ingress layer, a typo in one team’s path rule can take an unrelated team’s traffic with it. Separation of concerns is usually sold as elegance. In production, it is mostly sold as smaller incidents.
What Ingress made you beg your controller to do
Now for the features, briefly, because the features are genuinely less interesting than the reframe behind them.
Take canary deployments. With Ingress on nginx, weight-based traffic splitting means creating a second Ingress object, blessing it with ‘canary: “true”’ and ‘canary-weight: “10”’ annotations, and trusting that the controller interprets your strings correctly. With Gateway API, an HTTPRoute simply lists two backends with weights, 90 and 10, as ordinary structured fields. The API server validates them. Your canary rollout is now plain YAML instead of an incantation, and you did not have to install a service mesh to get it.
Header-based routing gets the same treatment. Routing requests with ‘x-beta-user: true’ to a different backend is a match condition in the spec, not a regex pasted into a controller-specific snippet. URL rewriting is a filter. Request mirroring, the trick where you copy live traffic to a new version without affecting real responses, is a filter too. Timeouts, header manipulation, traffic redirection, all first-class citizens with schemas.
Here is the reframe. None of these capabilities are new. Your reverse proxy could do all of this in 2016; reverse proxies are old and wise. What was missing was a portable way to ask for it. Under Ingress, every feature beyond host-and-path routing required learning the proprietary annotation dialect of whichever controller you happened to inherit, and your hard-won fluency in nginx annotations was worth exactly nothing the day someone migrated to Traefik. Gateway API moves those features into the spec itself, where they are typed, validated, and identical across implementations. The knowledge finally transfers. So do the manifests.
GatewayClass is the new vendor coupling point, and that is a better deal
Time for the honest section, because every article praising a new standard owes you one.
Gateway API does not eliminate vendor lock-in, and anyone telling you otherwise is selling a controller. The GatewayClass is where you commit. You pick Cilium, or Envoy Gateway, or Istio, or nginx-gateway-fabric, and from that moment your gateways run on that implementation’s machinery, with that implementation’s performance profile and that implementation’s extension features. Conformance across implementations is real but not absolute; the spec has core features everyone must support and extended ones they may.
What changed is the geometry of the coupling. With Ingress, the vendor dependency was smeared across your entire estate, hiding inside opaque annotation strings on every single routing object. You could not see it, measure it, or contain it; you discovered its true size on migration day, which is the worst possible day to discover anything. With Gateway API, the coupling is compressed into one object type. Everything above the GatewayClass (your routes, your matches, your filters, your weights) is portable standard YAML. Everything below it is the vendor’s problem. Swapping implementations becomes “change the GatewayClass and re-test”, not “translate three hundred annotations from one dialect to another and pray”.
The ecosystem, for the record, is not a science fair. Cilium ships a Gateway implementation on eBPF. Envoy Gateway is the CNCF’s straightforward Envoy packaging. Istio treats Gateway API as its preferred configuration surface these days. nginx-gateway-fabric exists for the sizable demographic that would like to keep nginx but lose the annotations. All of these run in production at companies whose outages would make the news.
You do not need to migrate everything to start
The best property of Gateway API for anyone with an existing cluster is that it demands nothing of your existing cluster. Gateway API and Ingress run side by side indefinitely. The controllers do not fight, the resources do not overlap, and your hundred working Ingress objects can keep working while you experiment two namespaces away.
The sensible entry point is not a migration project (migration projects are where enthusiasm goes to file status reports). It is one new service, or one feature branch, routed through an HTTPRoute while everything else stays put. You get a feel for the model, your platform team writes its first Gateway, and the canary feature gets a real audition on something low-stakes.
Whether your cluster is already prepared takes one command to find out.
kubectl get crds | grep gateway.networking.k8s.io
If that returns a list of CRDs, the welcome mat is already out; managed offerings like GKE ship them preinstalled. If it returns nothing, the installation is a single manifest from the Gateway API releases page, and then the welcome mat is out.
Ingress will keep working for years. Frozen APIs in Kubernetes enjoy long, comfortable retirements, and nobody is coming to delete your manifests. But every new routing feature, every new controller capability, and increasingly every new piece of documentation is being written for the other API now. Borrowed time is still time. It is just no longer the kind you should be building on.
There is a special kind of morning reserved for DevOps teams. The coffee is still too hot, Slack is already too loud, and somewhere in the dependency tree, a package you have never consciously chosen has decided to become a tiny criminal enterprise.
Not a glamorous one. Not the cinematic kind with laser grids, violin music, and a morally complicated mastermind in a black turtleneck. This one wore the traditional uniform of modern software crime, a ‘package.json’ file, a lifecycle hook, and the quiet confidence of something that knows your CI/CD pipeline will execute almost anything if it arrives through the correct registry.
The Mini Shai-Hulud attack against the AntV npm ecosystem was not frightening because it was exotic. It was frightening because it was ordinary. A compromised maintainer account. A burst of malicious package versions. A ‘preinstall’ hook. A build server with secrets lying around like biscuits in a meeting room.
That is the part worth sitting with for a moment. Your pipeline did not fail because it was stupid. It failed because it behaved exactly as designed.
The morning npm trusted a stranger
On May 19, a maintainer account named ‘atool’, associated with the AntV visualization ecosystem and several widely used utility packages, was compromised. In a short automated burst, malicious versions were published across more than 300 npm packages. Some reports counted 314 packages tied to the compromised maintainer. Others counted a slightly broader set, depending on the package universe being measured. Either way, this was not a polite disturbance. It was an npm fire drill with the alarm wired directly into your build system.
The affected ecosystem included packages such as ‘size-sensor’, ‘echarts-for-react’, ‘timeago.js’, and many ‘@antv’ packages. Collectively, the package set represented roughly sixteen million weekly downloads. That number has the calm, bureaucratic feel of a spreadsheet cell, which is unfortunate, because the spreadsheet cell is quietly screaming.
The payload was not a kernel exploit. It was not a secret zero-day whispered into existence by a nation-state intern with excellent dental insurance. It was a preinstall hook that executed an obfuscated Bun script before the application had even reached the part of the day where tests pretend they are in charge.
That is the insult. The thief did not pick the lock. The thief rang the bell, wore a delivery jacket, and your pipeline said, “Of course, please come in. The cloud credentials are near the snacks.”
Why did your pipeline not see it coming?
Most CI/CD pipelines are optimized for speed, repeatability, and the pleasant fiction that dependencies are small sealed boxes of usefulness. A typical workflow clones the repository, restores a cache, runs ‘npm ci’, then moves on to tests, linters, SAST tools, dependency scanners, container builds, and finally deployment.
That order feels reasonable. It is also the problem.
The malicious ‘preinstall’ hook runs during dependency installation. It runs before your tests. Before your linter. Before the container image scanner gets to put on its tiny detective hat. Before most of the tools you bought, integrated, configured, and proudly presented in a security maturity slide deck have even entered the room.
By the time your scanner examines the artifact, the install phase may already have executed hostile code inside your build environment. The patient is now wearing the doctor’s coat.
This is the architectural blind spot. We often talk about CI/CD as plumbing, as if pipelines merely transport code from Git to production with the emotional depth of a garden hose. In practice, the build environment is one of the most privileged pieces of compute in the company.
It can read source code. It can fetch dependencies. It can publish artifacts. It can assume cloud roles. It can push containers. It can sign releases. It may have access to deployment tokens, package registry tokens, GitHub tokens, npm tokens, cloud credentials, vault credentials, and enough environment variables to make a compliance auditor age visibly.
Then, in the middle of that privileged environment, we run arbitrary community code as a normal business process.
We do this every day. We call it productivity because “ritualized trust falls with strangers” was apparently less attractive in Jira.
When your EC2 instance becomes a credential vending machine
The build server is only one part of the blast radius. Many organizations still run Node.js applications directly on EC2 instances, virtual machines, shared development servers, bastion hosts, or old pets with sentimental names and systemd units no one wants to touch.
If a malicious dependency runs during an install on one of those machines, the question becomes brutally simple. What can that machine see?
Mini Shai-Hulud style payloads are designed to ask exactly that. They look for AWS credentials in environment variables and local credential files. They probe cloud metadata services. They search for Kubernetes service account tokens mounted in predictable paths. They hunt for GitHub personal access tokens, npm tokens, HashiCorp Vault tokens, SSH keys, database connection strings, and local password manager material.
This is where the story stops being a malware story and becomes an architecture story.
The problem is not merely that the script is clever. The problem is that many machines are already arranged like vending machines for secrets. Insert malicious lifecycle hook. Receive access keys. Enjoy your snack.
If your EC2 user data script runs ‘npm install’ during bootstrap, you have given install-time code a front-row seat to the instance identity. If developers SSH into a shared VM and run package installs manually, you have blended local development, shared infrastructure, and cloud access into a smoothie with bits of glass in it. If a bastion host has credentials on disk because “it was only temporary”, congratulations, you have discovered the half-life of temporary infrastructure. It is forever, unless audited.
The uncomfortable lesson is not that EC2 is unsafe. EC2 is a perfectly respectable building block. The trouble begins when long-lived compute accumulates credentials the way kitchen drawers accumulate mysterious cables. After enough time, nobody knows what they are for, but everyone is afraid to throw them away.
The SaaS services you thought were sandboxed
Managed build platforms are not magically exempt from this pattern. Vercel, Netlify, Railway, Render, AWS Amplify, Google Cloud Build, and similar services often run dependency installation on your behalf. They do it in ephemeral containers, which sounds reassuring, because ephemeral is one of those cloud words that makes everything feel rinsed and hygienic.
But ephemeral does not mean harmless.
Those containers may still receive environment variables. They may still hold deployment credentials. They may still have API keys, database URLs, webhook secrets, third-party tokens, and production-adjacent configuration. A malicious ‘preinstall’ hook does not need a permanent server. It only needs a few seconds with the things you carefully injected into the build because the deployment would not work without them.
This is where the boundary between build time and runtime starts to look theatrical. We like to pretend they are separate kingdoms with guards and flags and polite customs inspections. In reality, build time often has enough access to affect runtime, and runtime secrets often leak backward into build time because somebody needed a preview deployment to talk to a real database “just for testing”.
The SaaS provider may provide isolation. It may provide clean containers. It may even provide excellent defaults. But your build environment is still your environment. You configured the secrets. You selected the dependencies. You allowed the install scripts. The sandbox is not a moral force. It is a container with permissions.
And containers, bless them, do not experience shame.
When the green badge smiles at the robber
The most unsettling part of Mini Shai-Hulud was not just credential theft. It was the way the attack interacted with modern supply chain trust.
Some malicious packages were observed with valid Sigstore and SLSA provenance signals. In plain English, the pipeline identity could be used to produce cryptographic evidence that looked legitimate. The signature was real. The attestation was real. The code was malicious.
This is a deeply unpleasant sentence for anyone who has spent the last few years building policies around signed artifacts, provenance, and supply chain gates.
Those controls still matter. They are not useless. But this attack is a reminder that provenance is not a spell. It tells you something about how an artifact was built, and sometimes where it was built. It does not automatically tell you that the person, process, maintainer account, or CI identity involved was trustworthy at that moment.
A green badge can prove that the robbery happened in a certified room with excellent lighting.
For cloud architects, that distinction matters. If your policy says “only deploy signed artifacts”, you have improved the baseline. If your mental model says “signed means safe”, the attacker has just found a very comfortable chair in your control plane.
The right question is not only whether an artifact is signed. It is whether the identity that signed it should have been allowed to sign it, whether the workflow that produced it was protected, whether the release path was expected, whether the maintainer account had strong controls, and whether the dependency version appeared with the behavior of a normal release or with the body language of a raccoon in a data center.
Signatures are evidence. They are not character witnesses.
What to change before the next deployment
There is no single magic fix, which is irritating, because single magic fixes are much easier to put on a roadmap. What you can do is reduce the number of places where arbitrary install-time code meets valuable credentials.
Start with the obvious rule that is somehow still controversial. Do not run npm install in production on long-lived machines. Build once in a controlled environment. Bake dependencies into immutable images or artifacts. Promote those artifacts across environments. Production should receive the finished meal, not a bag of groceries and a stranger with a knife.
Use lockfiles with discipline. Treat changes to ‘package-lock.json’, ‘pnpm-lock.yaml’, or ‘yarn.lock’ as meaningful code changes. Review them. Pin dependencies where it matters. Avoid allowing automatic minor or patch upgrades in privileged CI jobs without human review or a quarantine window. Freshly published packages are not necessarily fresh bread. Sometimes they are bread with a tiny radio transmitter inside.
Disable install scripts where you can. For many CI validation jobs, ‘npm ci –ignore-scripts’ is a reasonable default. When lifecycle scripts are genuinely required, make that an explicit exception rather than a silent assumption. Exceptions should feel slightly annoying. That is how you know they are doing their job.
Separate build secrets from runtime secrets. A build job should not need direct access to production databases. It should not carry cloud admin credentials. It should not have permission to do everything because it is easier than discovering the three actions it actually needs. Use short-lived credentials through OIDC where possible, scoped narrowly to the job, the repository, the branch, and the environment.
Treat the build environment as hostile until proven otherwise. Run builds in ephemeral, isolated environments. Avoid reusing caches between trusted and untrusted contexts. Restrict egress where practical. Monitor unusual outbound traffic from CI runners, especially to metadata endpoints, GitHub APIs, unknown domains, and places where stolen secrets go to begin their new life.
On AWS, enforce IMDSv2 and restrict access to instance metadata. Do not let random processes on a host treat the metadata service like a neighborhood tapas bar. On Kubernetes, avoid mounting default service account tokens into pods that do not need them. If a pod has no business speaking to the Kubernetes API, do not give it a tiny passport and a laminated badge.
Finally, treat developer workstations as part of the production risk surface. This is annoying because developers are humans, and humans enjoy installing things. But if a developer runs npm install on a laptop that has AWS SSO sessions, GitHub tokens, package registry credentials, SSH keys, and password manager integrations, that laptop is not merely a laptop. It is a small branch office with stickers.
The uncomfortable truth about convenience
The cloud industry has spent more than a decade optimizing for developer velocity. We made dependency installation fast. We made CI/CD pipelines automatic. We made SaaS build platforms beautifully simple. We taught ourselves to trust registries because the alternative was slow, manual, and socially unpopular.
Mini Shai-Hulud is not the end of that model. It is the invoice.
The convenience of ‘npm install’ is not free. It is a line of credit against your security posture, and the interest rate just went up.
This does not mean we should retreat into caves and compile everything by candlelight, although some incident response teams have looked into it. It means we need to stop treating dependency installation as a harmless clerical step. It is code execution. It happens early. It happens often. It happens in places where secrets live.
That is the part that should make every DevOps engineer, platform engineer, and cloud architect feel a small chill behind the neck. Not panic. Panic is noisy and usually produces dashboards. A chill is more useful. A chill asks better questions.
Why does this build job have access to production credentials?
Why can this runner reach the metadata service?
Why are install scripts enabled by default?
Why are we deploying from a machine where somebody also tests packages manually?
Why did the green badge make us stop thinking?
Modern DevOps was already a strange job. You were part sysadmin, part release engineer, part therapist for YAML, part barista for impatient microservices. Now, occasionally, you must also check whether your pipeline has become an accomplice to a robbery.
It will not look guilty. Pipelines never do. They fail with clean logs, pass with suspicious confidence, and continue brewing coffee while a stranger quietly empties the safe.
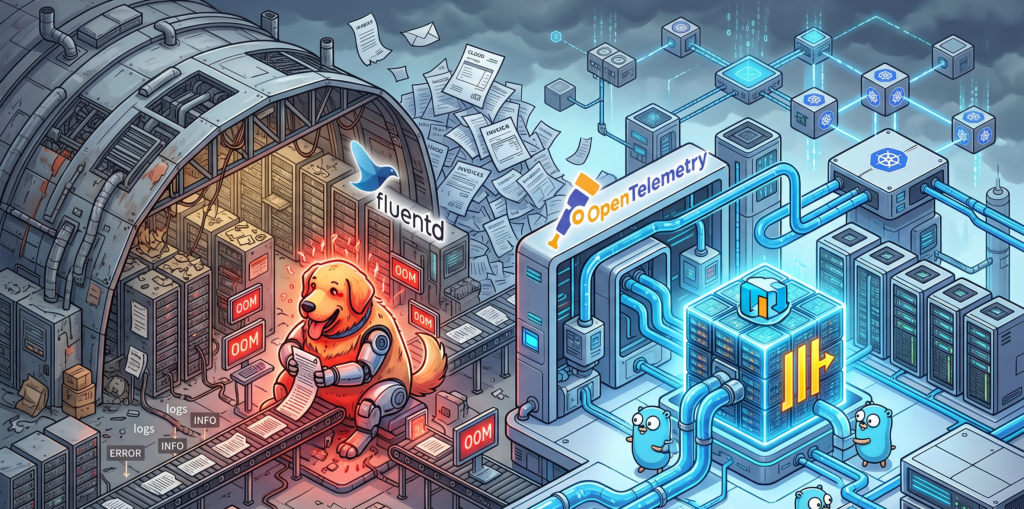
Your monthly cloud infrastructure bill arrives in your inbox. You open the PDF document, and suddenly your left eyelid starts twitching uncontrollably. The finance department has started leaving passive-aggressive sticky notes on your monitor. You realize you are spending the equivalent of a small nation’s gross domestic product just to store text files that repeat “INFO: User logged in” three billion times a day. Welcome to the modern logging crisis.
For years, the Kubernetes logging ecosystem was basically on autopilot. You installed the EFK stack (Elasticsearch, Fluentd, and Kibana), and it just worked. It was the safest default in the industry. But as we navigate through 2026, something has fundamentally ruptured. EFK did not suddenly become toxic waste overnight. It simply became the victim of its own architecture in an era where log volumes have mutated into unrecognizable monsters.
The shift away from EFK is not driven by shiny object syndrome. It is driven by raw economics, hardware exhaustion, and the very human desire not to wake up sweating at 3 AM because a logging cluster ran out of disk space.
The golden retriever in the sausage factory
Let us start with Fluentd. Fluentd is incredibly stable, highly flexible, and has served the community well. However, it is written in Ruby.
Under moderate loads, Fluentd is a perfectly polite guest. But when you expose it to the high-demand environments of modern microservices, Fluentd exhibits the same impulse control as an unsupervised Golden Retriever locked inside a sausage factory. It just eats all your available CPU and RAM until it physically cannot hold any more, burps an Out Of Memory error, and then politely demands that you scale it horizontally.
This operational overhead becomes exhausting. The industry needed something leaner. Enter the OpenTelemetry Collector. Written in Go, it processes telemetry data with the cold, calculated efficiency of an IRS auditor. It handles metrics, traces, and logs in a unified pipeline without treating your server’s memory like an all you can eat buffet.
Here is what a modern, lightweight pipeline configuration looks like today, completely devoid of Ruby overhead:
The real villain in your cloud bill, however, is not the collector. It is the storage layer. Elasticsearch is an absolute marvel of engineering if you are trying to build a complex search engine for an e-commerce website. But using it exclusively to store application logs is an architectural tragedy.
Storing logs in Elasticsearch is like packing a single pair of socks in an individual cardboard box, wrapping that box in three layers of industrial bubble wrap, and attaching a GPS tracker to it. Yes, the inverted index structure guarantees that you will find those specific socks at the speed of light. But your luggage now occupies three entire aviation hangars, and the monthly rent is absurd. The indexing process creates massive data bloat, multiplying your storage footprint and your anxiety levels simultaneously.
The bouillon cube of observability
This is where ClickHouse enters the scene and aggressively rewrites the rules. ClickHouse looks at your three hangars full of bubble-wrapped socks, throws them into an industrial shredder, and compresses the resulting mass into a super dense data bouillon cube.
ClickHouse relies on columnar storage and sparse indexes. It does not index every single word of your log lines. Instead, it compresses the data so tightly that your storage footprint shrinks to a fraction of what EFK required. And because developers already dream in SQL, querying this massive block of data feels entirely natural.
Instead of wrestling with Kibana’s proprietary query language just to find out why a payment failed, your team can simply run a query like this:
-- Finding errors without going bankrupt
SELECT
    toStartOfMinute(timestamp) AS minute,
    count() AS total_errors,
    dictGet('services', 'name', service_id) AS service_name
FROM application_logs
WHERE level = 'ERROR' AND timestamp > now() - INTERVAL 1 HOUR
GROUP BY minute, service_name
ORDER BY minute DESC;
Grafana sits on top of this SQL engine like a happy gargoyle, providing the exact same dashboarding capabilities you used to get from Kibana, but with the added benefit of seamlessly linking your logs directly to your OpenTelemetry metrics and traces.
Swapping tires on the highway
Now, a word of caution. The worst thing you can do after reading this is to march into your office and delete your Elasticsearch cluster.
Transitioning from EFK to the OpenTelemetry and ClickHouse stack overnight is the IT equivalent of trying to change your car tires while driving at 120 miles per hour down the highway. You will almost certainly lose the chassis in the process.
A migration requires a gradual cutover. You must deploy the OpenTelemetry Collector alongside your existing Fluentd setup. Route a small subset of non critical logs to ClickHouse. Compare the ingestion rates. Let your team practice writing SQL queries to find errors. Only when you are confident that the bouillon cube is holding its shape should you start decommissioning the old, expensive hangars.
When to completely ignore my advice
To be perfectly fair, EFK is not dead for everyone. If your daily log volume fits comfortably on a standard thumb drive, or if your company enjoys setting fire to piles of corporate cash to keep the server room warm, EFK remains a wonderfully easy solution. If your team has zero experience managing relational databases and relies heavily on managed Elasticsearch services, moving to ClickHouse might introduce more friction than it resolves.
But for the rest of the world, the verdict is clear. Do not migrate just because it is trendy. Migrate because your current system has become a financial bottleneck. If your Elasticsearch bill is the fastest growing metric in your entire company, that is your signal. Run the numbers, evaluate the OpenTelemetry stack, and stop paying hangar prices for your socks.
The internet has many glamorous job titles. Cloud architect. Platform engineer. Security specialist. Site reliability engineer, which sounds like someone hired to keep civilization from sliding gently into a ditch.
DNS has none of that glamour.
DNS is the receptionist sitting at the front desk of the internet, quietly answering the same question billions of times a day.
Where is this thing?
You type a name like “www.example.com”. Your browser nods with confidence, like a waiter who has written nothing down, and somehow a website appears. Behind that small miracle is DNS, the Domain Name System, a distributed naming system that turns human-friendly names into machine-friendly addresses.
Humans like names. Computers prefer numbers. This is one of the many reasons computers are not invited to dinner parties.
Without DNS, using the internet would feel like trying to visit every shop in town by memorizing its tax identification number. Possible, perhaps, but only for people who alphabetize their spice rack and have strong opinions about subnet masks.
DNS lets us type names instead of IP addresses. It maps domain names to the information needed to reach services, send email, verify ownership, issue certificates, and keep many small pieces of infrastructure from wandering into traffic.
It is boring in the way plumbing is boring. Nobody praises it when it works. Everybody becomes a philosopher when it breaks.
Why DNS exists
When you visit a website, your browser needs to know where that website lives. The name “google.com” is useful to you, but it is not directly useful to the machines moving packets across networks.
Those machines need IP addresses.
An IPv4 address looks like this.
142.250.184.206
An IPv6 address looks like this.
2a00:1450:4003:80f::200e
IPv6 addresses are what happens when a numbering system grows up, gets a mortgage, and decides readability is no longer its problem.
The basic job of DNS is to answer questions such as this.
What IP address should I use for www.example.com?
And then DNS replies with an answer such as this.
www.example.com -> 93.184.216.34
That is the simple version. It is true enough to be useful, but not complete enough to explain why DNS can ruin your afternoon while wearing the innocent expression of a houseplant.
The more accurate version is that DNS is a distributed, hierarchical, cached database. No single server knows everything. Instead, different parts of the DNS system know different parts of the answer, and resolvers know how to ask the right questions in the right order.
The internet’s receptionist does not keep every phone number in one drawer. That would be madness, and also suspiciously like a spreadsheet someone named Martin promised to maintain in 2017.
What happens when you type a domain name
When you type a website address into your browser, your machine does not immediately interrogate the entire internet. It starts closer to home, because even computers understand that walking across the office to ask a question is embarrassing if the answer was already on your desk.
A simplified DNS lookup usually works like this.
The browser checks whether it already knows the answer.
The operating system checks its own DNS cache.
The request may go to your router, corporate DNS, ISP resolver, or a public resolver such as Google DNS or Cloudflare DNS.
If the resolver does not already have the answer cached, it starts asking the DNS hierarchy.
It asks the root DNS servers where to find the servers for the top-level domain, such as .com.
It asks the .com servers where to find the authoritative nameservers for the domain.
It asks the authoritative nameserver for the actual record.
The IP address comes back.
Your browser connects to the server.
The website loads, assuming the rest of the internet has decided to behave.
This process often happens in milliseconds. It is quick enough to look like magic and structured enough to be bureaucracy.
That distinction matters.
Magic cannot be debugged. Bureaucracy can, provided you know which desk lost the form.
Recursive resolvers and authoritative nameservers
Two DNS roles are worth understanding early, because they explain a lot of real-world behavior.
The first is the recursive resolver.
This is the DNS server your device asks for help. It does the legwork. Your laptop says, “Where is www.example.com?” and the recursive resolver goes off to find the answer. It may already know the answer from cache, or it may need to ask other DNS servers.
The recursive resolver is the intern sent across the building with a clipboard and mild panic.
The second is the authoritative nameserver.
This is the DNS server that holds the official answer for a domain or zone. If a domain uses a particular DNS provider, such as Route 53, Cloud DNS, Cloudflare, or another provider, that provider’s authoritative nameservers are responsible for answering questions about the records configured there.
The authoritative nameserver is the person with the spreadsheet, the badge, and the unsettling confidence.
This difference matters because your laptop usually does not ask the authoritative nameserver directly. It asks a resolver. The resolver may answer from cache. That is why one person sees the new DNS record and another person, in the same meeting, sees the old one and begins quietly questioning reality.
DNS records are tiny instructions with large consequences
A DNS record is a piece of information stored in a DNS zone. It tells DNS what should happen when someone asks about a name.
A domain without DNS records is like an office building with no signs, no mailbox, no receptionist, and one confused courier holding your production traffic.
DNS records decide things like these.
Which IP address serves a website
Which hostname acts as an alias
Which servers receive email
Which systems are allowed to send email for a domain
Which certificate authorities may issue TLS certificates
Which nameservers are responsible for the domain
Which services exist under specific names
If DNS records are wrong, the result is rarely poetic. Websites stop loading. Email disappears into procedural fog. Certificates fail. Monitoring dashboards develop a sudden interest in the color red.
DNS records look small, but they carry adult responsibility.
A and AAAA records
The A record is the most basic DNS record. It maps a name to an IPv4 address.
example.com -> 192.0.2.10
This record says, with refreshing directness, “This name lives at this IPv4 address.”
The AAAA record does the same job for IPv6.
example.com -> 2001:db8:1234::10
A and AAAA records are common when you control the target IP address. For example, you may point a domain to a virtual machine, a static endpoint, or a load balancer with stable addresses.
In modern cloud environments, however, you often do not want to point directly to a single server. You may want to point to a load balancer, a CDN, or a managed service whose underlying IPs can change. That is where aliases and provider-specific features become important.
DNS is simple until cloud infrastructure arrives wearing three badges and carrying a YAML file.
CNAME records
A CNAME record creates an alias from one DNS name to another DNS name.
blog.example.com -> example-blog.provider.com
This does not work like an HTTP redirect. That distinction is important.
A browser redirect says, “Go to a different URL.”
A CNAME says, “This DNS name is really another DNS name. Ask about that one instead.”
It is not a forwarding service. It is an alias.
CNAME records are especially useful for subdomains. For example, you may point docs.example.com to a documentation platform, or shop.example.com to an e-commerce provider.
One important rule is that a CNAME normally cannot coexist with other records at the same name. If blog.example.com is a CNAME, it should not also have MX or TXT records at that exact same name. DNS dislikes identity crises.
Also, the root domain, often called the zone apex, such as example.com, usually cannot be a standard CNAME because it must have records like NS and SOA. Many DNS providers solve this with records called ALIAS or ANAME, or with provider-specific alias features.
For example, AWS Route 53 has Alias records, which are not a normal DNS record type but are extremely useful when pointing a root domain to an AWS load balancer, CloudFront distribution, or another AWS target.
The practical lesson is simple. Use CNAMEs for aliases when allowed. Use your DNS provider’s supported alias mechanism when dealing with root domains and cloud-managed targets.
This is DNS saying, “There are rules, but we have invented paperwork to survive them.”
MX records
MX records tell the world where email for a domain should be delivered.
example.com -> mail.example.com
In real DNS, MX records also have priorities. Lower numbers are preferred.
This means mail servers should try mail1.example.com first, and use mail2.example.com as a fallback.
MX records matter because email is not delivered to your website. It is delivered to mail servers responsible for your domain. This is why a website can work perfectly while email is broken, and everyone involved can be technically correct while still being deeply unhappy.
Email uses DNS heavily. MX records route the mail. TXT records help prove which systems are allowed to send it. PTR records may help receiving systems trust the sending server. Email security is basically DNS wearing a trench coat full of paperwork.
TXT records
TXT records store text. That sounds harmless, like a sticky note, until you realize that half the modern internet uses sticky notes to prove ownership, configure email security, and convince platforms that you are not a spam goblin.
TXT records are also used for domain verification. Google, Microsoft, GitHub, certificate providers, and many SaaS platforms may ask you to create a TXT record to prove that you control a domain.
The humble TXT record is DNS with a clipboard and a suspicious number of compliance responsibilities.
NS and SOA records
NS records define which nameservers are authoritative for a domain or zone.
Without correct NS records, resolvers may not know where to ask for official answers. That is a problem, because DNS without authority is just gossip with port 53.
SOA stands for Start of Authority. Every DNS zone has an SOA record. It contains administrative information about the zone, including the primary nameserver, contact details, serial number, and timing values used by secondary nameservers.
You usually do not edit SOA records during basic DNS work, but they exist behind the scenes. They are the domain’s administrative birth certificate, stored in a filing cabinet that occasionally matters a lot.
PTR records and reverse DNS
Most DNS lookups turn names into IP addresses. A PTR record does the reverse. It maps an IP address back to a name.
192.0.2.10 -> server.example.com
This is called reverse DNS.
Reverse DNS is often used in email systems, logging, security investigations, and operational troubleshooting. If a mail server sends email from an IP address, receiving systems may check whether reverse DNS makes sense. If it does not, the email may look suspicious.
PTR records are usually managed by whoever controls the IP address range, often a cloud provider, hosting provider, or network team. This is why you may control example.com but still need to configure reverse DNS somewhere else.
DNS enjoys reminding us that ownership is a layered concept, like lasagna or enterprise access management.
SRV and CAA records
SRV records describe where specific services are available. They are often used by systems such as VoIP, chat, directory services, or service discovery mechanisms.
An SRV record can include the service name, protocol, priority, weight, port, and target host.
_service._tcp.example.com -> target.example.com on port 443
Many people can use DNS for years without touching SRV records. Then one day a system requires them, and SRV appears like a cousin nobody mentioned during onboarding.
CAA records control which certificate authorities are allowed to issue TLS certificates for your domain.
example.com CAA 0 issue "letsencrypt.org"
This tells certificate authorities that Let’s Encrypt is allowed to issue certificates for the domain. Other certificate authorities should not.
CAA is a useful security control. It is not a magic shield, but it reduces the risk of unauthorized certificate issuance. Think of it as a small velvet rope in front of your TLS certificates. Not glamorous, but better than letting the entire street into the building.
TTL and the myth of DNS propagation
TTL means Time To Live. It tells DNS resolvers how long they may cache a DNS answer.
If a record has a TTL of 3600 seconds, a resolver can cache that answer for one hour.
This is where many DNS misunderstandings are born, raised, and eventually promoted into incident reports.
People often say, “DNS propagation takes time.” The phrase is common, but it can be misleading. DNS changes are not usually pushed across the internet like flyers under apartment doors. Most of the time, you are waiting for cached answers to expire.
If a resolver cached the old IP address five minutes before you changed the record, and the TTL was one hour, that resolver may continue returning the old answer until the cache expires.
A low TTL can make changes appear faster, but it can also increase DNS query volume. A high TTL reduces query volume, but it makes mistakes more persistent.
This is the technical equivalent of writing something in permanent marker because it felt efficient at the time.
Before planned DNS changes, teams often lower TTL values in advance. For example, if a record currently has a TTL of 86400 seconds, which is 24 hours, you might reduce it to 300 seconds a day before migration. Then, when you switch the record, cached answers expire much faster.
After the migration is stable, you may increase the TTL again.
This is not exciting work. It is careful work. DNS rewards careful people by giving them fewer reasons to age visibly during production changes.
Common ways DNS breaks things
DNS failures are rarely introduced with dramatic music. They usually arrive disguised as simple user complaints.
“The website is down.”
“Email is not arriving.”
“It works from my machine.”
“The old environment is still receiving traffic.”
These are not always DNS problems, but DNS should be part of the investigation.
Common issues include these.
An A record points to the wrong IP address.
A CNAME points to the wrong target.
A record was changed, but resolvers still have the old answer cached.
Nameservers at the registrar do not match the DNS provider where records were edited.
MX records are missing or misconfigured.
TXT records for SPF, DKIM, or DMARC are incomplete.
A certificate authority cannot issue a certificate because CAA records block it.
Internal and external DNS return different answers, and nobody documented the difference because optimism is cheaper than documentation.
A particularly common mistake is editing DNS records in the wrong place. The domain may be registered with one company, but the authoritative DNS may be hosted somewhere else. Changing records at the registrar will do nothing if the authoritative nameservers point to another DNS provider.
This is how people end up pressing Save repeatedly in a web console while DNS stares politely from another building.
DNS in cloud and DevOps
For cloud, DevOps, and platform engineering work, DNS is not optional background noise. It is where architecture becomes reachable.
A Kubernetes Ingress may expose an application through a cloud load balancer. DNS must point the application hostname to that load balancer.
A CDN such as CloudFront or Cloud CDN may sit in front of an application. DNS must point users toward the CDN, not directly to the origin.
A managed database, API gateway, object storage website, or SaaS platform may require CNAMEs, TXT verification records, private endpoints, or provider-specific aliases.
In AWS, Route 53 Alias records are commonly used to point domains to AWS resources such as Application Load Balancers or CloudFront distributions.
In GCP, Cloud DNS can host public or private zones, and DNS can be part of the design for internal services, private connectivity, and hybrid architectures.
In Kubernetes, internal DNS also matters. Services get names inside the cluster. Pods can call other services using names such as this.
my-service.my-namespace.svc.cluster.local
That internal DNS is different from public DNS, but the idea is related. Names hide moving parts. Services can change IP addresses. Pods can die and be replaced. DNS gives workloads a stable name to use while the infrastructure performs its little disappearing act.
Cloud architecture is full of things that move, scale, fail, restart, and get replaced. DNS is one of the systems that lets users pretend this is all very stable.
Bless DNS for its emotional labor.
Useful DNS troubleshooting commands
You do not need many tools to begin troubleshooting DNS. A few commands can reveal a lot.
Use dig to query DNS records.
dig example.com A
Query a specific resolver.
dig @8.8.8.8 example.com A
Check MX records.
dig example.com MX
Check TXT records.
dig example.com TXT
Trace the delegation path.
dig example.com +trace
Use nslookup if it is what you have available.
nslookup example.com
Use host for quick lookups.
host example.com
For operational troubleshooting, compare answers from different resolvers. Your corporate DNS, Google DNS, Cloudflare DNS, and the authoritative nameserver may not all return the same answer at the same time, especially after a recent change.
That does not always mean DNS is broken. Sometimes it means DNS is being DNS, which is not comforting, but it is accurate.
When the receptionist leaves the desk
DNS is one of those technologies that feels simple until you need to explain why production traffic is still going to the old load balancer, why email authentication broke after a migration, or why half the office sees the new website, and the other half appears trapped in yesterday.
At its heart, DNS turns names into answers.
But in real systems, those answers are cached, delegated, aliased, verified, prioritized, and sometimes misfiled in a place nobody checked because the meeting was already running long.
If you work with Linux, cloud, Kubernetes, DevOps, security, networking, or web platforms, DNS is not optional. It is one of the quiet foundations underneath everything else.
It does not look dramatic on architecture diagrams. It does not usually get its own epic in Jira. It does not wear a cape. It sits at the desk, answers questions, points traffic in the right direction, and receives blame with the exhausted dignity of someone who has been doing everyone else’s routing work for decades.
DNS is the internet’s most underpaid receptionist.
And when that receptionist goes missing, nobody gets into the building.
A surprising number of AI platforms begin life with a question that sounds reasonable in a standup and catastrophic in a postmortem, something along the lines of “Can we just stick a GPU behind an API?” You can. You probably shouldn’t. AI workloads are not ordinary web services wearing a thicker coat. They behave differently, fail differently, scale differently, and cost differently, and an architecture that ignores those differences will eventually let you know, usually on a Sunday.
This article is not about how to train a model. It is about building an AWS architecture that can host AI workloads safely, scale them reliably, and keep the monthly bill within shouting distance of the original estimate.
Why AI workloads change the architecture conversation
Treating an AI workload as “the same thing, but with bigger instances” is a classic and very expensive mistake. Inference latency matters in milliseconds. Accelerator choice (GPU, Trainium, Inferentia) affects both performance and invoice. Traffic spikes are unpredictable because humans, not schedulers, trigger them. Model lifecycle and data lineage become first-class design concerns. Governance stops being a compliance checkbox and becomes the seatbelt that keeps sensitive information from ending up inside a prompt log.
Put differently, AI adds several new axes of failure to the usual cloud architecture, and pretending otherwise is how teams rediscover the limits of their CloudWatch alerting at 3 am.
Start with the use case, not the model
Before anyone opens the Bedrock console, the first design decision should be the business problem. A chatbot for internal knowledge, a document summarization pipeline, a fraud detection scorer, and an image generation service have almost nothing in common architecturally, even if they all happen to involve transformer models.
From the use case, derive the architectural drivers (latency budget, throughput, data sensitivity, availability target, model accuracy requirements, cost ceiling). These drivers decide almost everything else. The opposite workflow, picking the infrastructure first and then seeing what it can do, is how you end up with a beautifully optimized cluster solving a problem nobody asked about.
Choosing your AI path on AWS
AWS offers several paths, and they are not interchangeable. A rough guide.
Amazon Bedrock is the right choice when you want managed foundation models, guardrails, agents, and knowledge bases without running the model infrastructure yourself. Good for teams that want to ship features, not operate GPUs.
Amazon SageMaker AI is the right choice when you need more control over training, deployment, pipelines, and MLOps. Good for teams with ML engineers who enjoy that sort of thing. Yes, they exist.
AWS accelerator-based infrastructure (Trainium, Inferentia2, SageMaker HyperPod) is the right choice when cost efficiency or raw performance at scale becomes the dominant constraint, typically for custom training or large-scale inference.
The common mistake here is picking the most powerful option by default. Bedrock with a sensible model is usually cheaper to operate than a custom SageMaker endpoint you forgot to scale down over Christmas.
The data foundation comes first
AI systems are a thin layer of cleverness on top of data. If the data layer is broken, the AI will be confidently wrong, which is worse than being uselessly wrong because people tend to believe it.
Answer the unglamorous questions first. Where does the data live? Who owns it? How fresh does it need to be? Who can see which parts of it? For generative AI workloads that use retrieval, add more questions. How are documents chunked? What embedding model is used? Which vector store? What metadata accompanies each chunk? How is the index refreshed when the source changes?
A poor data foundation produces a poor AI experience, even when the underlying model is state of the art. Think of the model as a very articulate intern; it will faithfully report whatever you put in front of it, including the typo in the policy document from 2019.
Designing compute for reality, not for demos
Training and inference are not the same workload and should rarely share the same architecture. Training is bursty, expensive, and tolerant of scheduling. Inference is steady, latency-sensitive, and intolerant of downtime. A single “AI cluster” that tries to do both tends to be bad at each.
For inference, focus on right-sizing, dynamic scaling, and high availability across AZs. For training, focus on ephemeral capacity, checkpointing, and data pipeline throughput. For serving large models, consider whether Bedrock’s managed endpoints remove enough operational burden to justify their pricing compared to self-hosted inference on EC2 or EKS with Inferentia2.
And please, autoscale. A fixed-size fleet of GPU instances running at 3% utilization is a monument to optimism.
Treating inference as a production workload
Many AI articles spend chapters on models and a paragraph on serving them, which is roughly the opposite of how the effort is distributed in real projects. Inference is where the workload meets reality, and reality brings concurrency, timeouts, thundering herds, and users who click the retry button like they are trying to start a stubborn lawnmower.
Plan for all of it. Set timeouts. Configure throttling and quotas. Add rate limiting at the edge. Use exponential backoff. Put circuit breakers between your application tier and your AI tier so a slow model does not take the whole product down. AWS explicitly recommends rate limiting and throttling as part of protecting generative AI systems from overload, and they recommend it because they have seen what happens without it.
Protecting inference is not mainly about safety. It is about surviving the traffic spike after your launch gets a mention somewhere popular.
Separating application, AI, and data responsibilities
A quietly important architectural point is that the AI tier should not share an account, an IAM boundary, or a blast radius with the application that calls it. AWS security guidance increasingly points toward separating the application account from the generative AI account. The reasoning is simple: the consequences of a mistake in prompt construction, data retrieval, or model output are different from the consequences of a mistake in, say, a shopping cart service, and they deserve different controls.
Think of it as the organizational version of not keeping your passport in the same drawer as your house keys. If one goes missing, the other is still where it should be.
Security and guardrails from day one
AI-specific controls sit on top of the usual cloud security hygiene (IAM least privilege, encryption at rest and in transit, VPC endpoints, logging, data classification). On top of that, you need approved model catalogues so teams cannot quietly wire up any foundation model they saw on Hacker News, prompt governance with templates and input validation and logging policies that do not accidentally store sensitive data forever, output filtering for harmful content and PII leakage and jailbreak attempts, and clear data classification policies that decide which data is allowed to reach which model.
For Bedrock-based systems, Amazon Bedrock Guardrails offer configurable safeguards for harmful content and sensitive information. They are not magic, but they save a surprising amount of custom work, and custom work in this area tends to age badly.
Governance is not bureaucracy. Governance is what lets your AI feature get through a security review without being rewritten twice.
Protecting the retrieval layer when you use RAG
Retrieval-augmented generation is often described as “LLM plus documents”, which is technically true and practically misleading. A production RAG system involves ingestion pipelines, embedding generation, a vector store, metadata design, and ongoing synchronization with source systems. Each of those is a place where things can quietly go wrong.
One specific point is worth emphasizing. User identity must propagate to the retrieval layer. If Alice asks a question, the knowledge base should only return chunks Alice is allowed to see. AWS guidance recommends enforcing authorization through metadata filtering so users only get results they have access to. Without this, your RAG system will happily summarize the CFO’s compensation memo for the summer intern, which is the sort of thing that gets architectures shut down by email.
Observability goes beyond CPU and memory
Traditional observability (CPU, memory, latency, error rates) is necessary but insufficient for AI workloads. For these systems, you also want to track model quality and drift over time, retrieval quality (are the right chunks being returned?), prompt behavior and common failure modes, token usage per request and per tenant and per feature, latency per model and not just per service, and user feedback signals, with thumbs-up and thumbs-down being the cheapest useful telemetry ever invented.
Amazon Bedrock provides evaluation capabilities, and SageMaker Model Monitor covers drift and model quality in production. Use them. If you run your own inference, budget time for custom metrics, because the default dashboards will tell you the endpoint is healthy right up until users stop trusting its answers.
AI operations is not a different discipline. It is mature operations thinking applied to a stack where “the service works” and “the service is useful” are two different statements.
Cost optimization belongs in the first draft
Cost should be a design constraint, not a debugging session six weeks after launch. The biggest levers, roughly in order of impact.
Model choice. Smaller models are cheaper and often good enough. Not every feature needs the largest frontier model in the catalogue.
Inference mode. Real-time endpoints, batch inference, serverless inference, and on-demand Bedrock invocations have wildly different cost profiles. Match the mode to the traffic pattern, not the other way around.
Autoscaling policy. Scale to zero where possible. Keep the minimum capacity honest.
Hardware choice. Inferentia2 and Trainium are positioned specifically for cost-effective ML deployment, and they often deliver on that positioning.
Batching. Batching inference requests can dramatically improve throughput per dollar for workloads that tolerate small latency increases.
A common failure mode is the impressive prototype with the terrifying monthly bill. Put cost targets in the design document next to the latency targets, and revisit both before go-live.
Close with an operating model, not just a diagram
An architecture diagram is the opening paragraph of the story, not the whole book. What makes an AI platform sustainable is the operating model around it (versioning, CI/CD or MLOps/LLMOps pipelines, evaluation suites, rollback strategy, incident response, and clear ownership between platform, data, security, and application teams).
AWS guidance for enterprise-ready generative AI consistently stresses repeatable patterns and standardized approaches, because that is what turns successful experiments into durable platforms rather than fragile demos held together by one engineer’s tribal knowledge.
What separates a platform from a demo
Preparing a cloud architecture for AI on AWS is not mainly about buying GPU capacity. It is about designing a platform where data, models, security, inference, observability, and cost controls work together from the start. The teams that do well with AI are not the ones with the biggest clusters; they are the ones who took the boring parts seriously before the interesting parts broke.
If your AI architecture is running quietly, scaling predictably, and costing roughly what you expected, congratulations, you have done something genuinely difficult, and nobody will notice. That is always how it goes.
Not long ago, a partner I work with told me about a company that decided it had finally had enough of AWS.
The monthly bill had become the sort of document people opened with the facial expression usually reserved for dental estimates. Consultants were invited in. Spreadsheets were produced. Serious people said serious things about control, efficiency, and the wisdom of getting off the cloud treadmill.
The conclusion sounded almost virtuous. Leave AWS, move the workloads to a colocation facility, buy the hardware, and stop renting what could surely be owned more cheaply.
It was neat. It was rational. It was, for a while, deeply satisfying.
And then reality arrived, carrying invoices.
The company spent a substantial sum getting out of AWS. Servers were bought. Contracts were signed. Staff had to be hired to manage all the things cloud providers manage quietly in the background while everyone else gets on with their jobs. Not long after, the economics began to fray. Reversing course costs even more than leaving in the first place.
That is the part worth paying attention to.
Not because it makes for a dramatic story, though it does. Not because it is especially rare, but because it is not. It matters because it exposes one of the oldest tricks in infrastructure decision-making. Companies compare a visible bill with an invisible burden, decide the bill is the scandal, and only later discover that the burden was doing quite a lot of useful work.
The spreadsheet seduction
On paper, the move away from AWS looked wonderfully sensible.
The cloud bill was obvious, monthly, and impolite enough to keep turning up. On-premises looked calmer. Hardware could be amortized. Rack space, power, and bandwidth could be priced. With a bit of care, the whole thing could be made to resemble prudence.
This is where many repatriation plans become dangerously persuasive. The cloud is cast as an extravagant landlord. On-premises is presented as the mature decision to stop renting and finally buy the house.
Unfortunately, a data center is not a house. It is closer to owning a very large hotel whose plumbing, wiring, keys, security, fire precautions, laundry, and unexpected midnight incidents are all your responsibility, except the guests are servers and none of them leave a tip.
The spreadsheet had done a decent job of pricing the obvious things. Hardware. Colocation space. Power. Connectivity.
What was priced badly were all the dull, expensive capabilities that public cloud tends to bundle into the bill. Managed failover. Backup automation. Key rotation. Elastic capacity. Security controls. Compliance support. Monitoring that does not depend on a specific engineer being awake, available, and emotionally prepared.
What looked like cloud excess turned out to include a great deal of cloud competence.
That distinction matters.
A large cloud bill is easy to resent because it is visible. Operational competence is harder to resent because it tends to be hidden in the walls.
What the cloud had been doing all along
One of the costliest mistakes in infrastructure is confusing convenience with fluff.
A managed database can look expensive right up to the moment you have to build and test failover yourself, define recovery objectives, handle maintenance windows, rotate credentials, validate backups, and explain to auditors why one awkward part of the process still depends on a human remembering to do something after lunch.
A content delivery network may seem like a luxury until you try to reproduce low-latency delivery, edge caching, certificate handling, resilience, and attack mitigation with a mixture of hardware, internal effort, procurement delays, and hope.
The company, in this case, had not really been paying AWS only for compute and storage. It had been paying AWS to absorb a long list of repetitive operational chores, specialized platform decisions, and uncomfortable edge cases.
Once those chores came back in-house, they did not return politely.
Redundancy stopped being a feature and became a budget line, followed by an implementation plan, followed by a maintenance burden. Security controls that had once been inherited now had to be selected, deployed, documented, checked, and defended. Compliance work that had once been partly automated became a steady stream of evidence gathering, procedural discipline, and administrative repetition.
Cloud bills can look high. So can plumbing. You only discover its emotional value when it stops working.
The talent tax
The easiest part of moving on premises is buying equipment.
The harder part is finding enough people who know how to run the surrounding world properly.
Cloud expertise is now common enough that many companies can hire engineers comfortable with infrastructure as code, IAM, managed services, container platforms, observability, autoscaling, and cost controls. Strong cloud engineers are not cheap, but they are at least visible in the market.
Deep on-premises expertise is another matter. People who are strong in storage, backup infrastructure, virtualization, physical networking, hardware lifecycle, and operational recovery still exist, but they are not standing about in large numbers waiting to be discovered. They are experienced, expensive, and often well aware of their market value.
There is also a cultural issue that rarely appears in repatriation slide decks. A great many engineers would rather write Terraform than troubleshoot a hardware issue under unflattering lighting at two in the morning. This is not a moral failure. It is simple market gravity. The industry has spent years abstracting away routine infrastructure pain because abstraction is usually a better use of skilled human attention.
The partner who told me this story was particularly clear on this point. The staffing line looked manageable in planning. In practice, it turned into one of the most stubborn and underestimated parts of the whole effort.
Cloud is not cheap because expertise is cheap. Cloud is often cheaper because rebuilding enough expertise inside one company is very expensive.
Why does utilization lie so beautifully
Projected utilization is one of those numbers that becomes more charming the less time it spends near reality.
Many repatriation models assume that servers will be well used, capacity will be planned sensibly, and waste will be modest. It sounds disciplined. Responsible, even.
Real workloads behave less like equations and more like kitchens during a family gathering. There are quiet periods, sudden rushes, abandoned experiments, quarter-end panics, new projects that arrive with urgency and no warning, and services no one remembers until they break.
Elasticity is not a decorative feature added by cloud providers to justify themselves. It is one of the main ways organizations avoid buying for peak demand and then spending the rest of the year paying for machinery to sit about waiting.
Without elasticity, you provision for the busiest day and fund the silence in between.
Silence, in infrastructure, is expensive.
A half-used on-premises platform still consumes power, occupies space, demands maintenance, requires patching, and waits patiently for a workload spike that visits only now and then. Spare capacity has excellent manners. It makes no fuss. It simply eats money quietly and on schedule.
This was one of the turning points in the story I heard. Forecast utilization turned out to be far more flattering than actual utilization. Once that happened, the economics began to sag under their own good intentions.
The cost of becoming slower
Traditional total-cost comparisons handle direct spending reasonably well. They are much worse at pricing lost momentum.
When a company runs on a large cloud platform, it does not merely rent infrastructure. It also gains access to a constant flow of improvements and options. Better analytics tools. New security integrations. Managed AI services. Identity features. Database capabilities. Deployment patterns. Networking enhancements. Observability tooling.
No single addition changes everything overnight. The effect is cumulative. It is a thousand small conveniences arriving over time and sparing teams from having to rebuild ordinary civilization every quarter.
An on-premises platform can be stable and well run. For the right workloads, that may be perfectly acceptable. But it does not evolve at the pace of a hyperscaler. Upgrades become projects. New capabilities require procurement, testing, staffing, and patience. The platform becomes more careful and, usually, slower.
That slower pace does not always show up neatly in a spreadsheet, but engineers feel it almost immediately.
While competitors are experimenting with new managed services or shipping new capabilities faster, the repatriated organization may be spending its time improving backup procedures, standardizing tools, negotiating maintenance arrangements, or replacing hardware that has chosen an inconvenient moment to become philosophical.
There is nothing glamorous about that. There is also nothing free about it.
Who should actually consider on-premises
None of this means on-premises is foolish.
That would be a lazy conclusion, and lazy conclusions are where expensive architecture plans begin.
For some organizations, on-premises remains entirely reasonable. It makes sense for highly predictable workloads with very little variability. It can make sense in tightly regulated environments where legal, sovereignty, or operational constraints sharply limit the use of public cloud. And at a very large scale, some organizations genuinely can justify building substantial parts of their own platform.
But most companies tempted by repatriation are not in that category.
They are not hyperscalers. They are not all running flat, perfectly predictable workloads. They are not all boxed in by constraints that make public cloud impossible. More often, they are reacting to a painful cloud bill caused by weak cost governance, poor workload fit, loose architecture discipline, or a lack of serious FinOps.
That is a very different problem.
Leaving AWS because you are using AWS badly is a bit like selling your refrigerator because the groceries keep going off while the door is open. The appliance may not be the heart of the matter.
The middle ground companies skip past
One of the stranger features of cloud debates is how quickly they become binary.
Either remain in public cloud forever, or march solemnly back to racks and cages as if returning to a lost ancestral craft.
There is, of course, a middle ground.
Some workloads do benefit from local placement because of latency, residency, plant integration, or operational constraints. But needing hardware closer to the ground does not automatically mean rebuilding the entire service model from scratch. The more useful question is often not whether the hardware should be local, but whether the control plane, automation model, and day-to-day operations should still feel cloud-like.
That is a much more practical conversation.
A company may need some infrastructure nearby while still gaining enormous value from managed identity, familiar APIs, consistent automation, and operational patterns learned in the cloud. This tends to sound less heroic than a full repatriation story, but heroism is not a particularly reliable basis for infrastructure strategy.
The partner who described this case said as much. If they had explored the middle road earlier, they might have kept the local advantages they wanted without assuming quite so much of the surrounding operational burden.
What a real repatriation audit should include
Any company seriously considering a move off AWS should pause long enough to perform an audit that is a little less enchanted by ownership.
Start with the full cloud picture, not just the line items everyone enjoys complaining about. Include engineering effort, compliance automation, security services, platform speed, operational overhead, and the cost of scaling quickly when demand changes.
Then build the on-premises model with uncommon honesty. Price round-the-clock operations. Price redundancy properly. Price backup and recovery as if they matter, because they do. Price refresh cycles, maintenance contracts, spare capacity, patching, testing, physical security, audit evidence, and the awkward certainty that hardware fails when it is least convenient.
Then ask a cultural question, not just a financial one. How many of your engineers actually want to spend more of their time dealing with the physical stack and the operational plumbing that comes with it?
That answer matters more than many executives would like.
A strategy that looks cheaper on paper but nudges your best engineers toward the door is not, in any meaningful sense, cheaper.
Finally, compare repatriation not only against your current cloud bill, but against what a disciplined cloud optimization program could achieve. Rightsizing, storage improvements, better instance strategy, autoscaling discipline, reserved capacity planning, architecture cleanup, and proper FinOps can all change the economics without requiring anyone to rediscover the intimate emotional texture of broken hardware.
The bill behind the bill
What has stayed with me about this story is that it was never really a story about AWS.
It was a story about accounting for the wrong thing.
The visible bill was treated as the entire problem. The hidden work behind the bill was treated as background scenery. Once the company moved off AWS, the scenery walked to the front of the stage and began sending invoices.
That is the trap.
Cloud can absolutely be expensive. Plenty of organizations run it badly and pay for the privilege. But on-premises is not automatically the sober adult in the room. Quite often, it is simply a different payment model, one that hides more of the cost in staffing, slower delivery, operational fragility, maintenance overhead, and all the unlovely little chores that cloud platforms had been taking care of out of sight.
The lesson from this case was not that every workload belongs in AWS forever. It was that infrastructure decisions become dangerous when they are made in reaction to irritation rather than in response to a full economic picture.
Leaving the cloud may still be the right answer for some organizations. For many others, the more useful answer is much less theatrical. Use the cloud better. Govern it better. Design it properly. Understand what you are paying for before deciding you would prefer to rebuild it yourself.
A large monthly cloud bill can be offensive to look at.
The bill that arrives after a bad attempt to escape it is usually less offensive than heartbreaking.
And heartbreak, unlike EC2, rarely comes with autoscaling.
Let us be perfectly honest about multi-cloud environments. They are not a harmonious symphony of computing power. They are a logistical nightmare, roughly equivalent to hosting a dinner party where one guest only eats raw vegan food, another demands a deep-fried turkey, and the third will only consume blue candy. You are running around three different kitchens trying to keep everyone alive and happy while speaking three different languages.
For years, we relied on Terraform or its open-source sibling OpenTofu to manage this chaos. These tools are fantastic, but they come with a terrifying piece of baggage known as the state file. The state file is essentially a fragile, highly sensitive diary holding the deepest, darkest secrets of your infrastructure. If that file gets corrupted or someone forgets to lock it, your cloud provider develops sudden amnesia and forgets where it put the database.
Kubernetes evolved quite a bit while we were busy babysitting our state files. It stopped being just a container orchestrator and started trying to run the whole house. Every major cloud provider released their own Kubernetes operator. Suddenly, you could manage a storage bucket or a database directly from inside your cluster. But there was a catch. The operators refused to speak to each other. You essentially hired a team of brilliant specialists who absolutely hate each other.
This is exactly where Crossplane steps in to act as the universal, unbothered therapist for your infrastructure.
Meet your new obsessive infrastructure butler
Crossplane does not care about vendor rivalries. It installs itself into your Kubernetes cluster and uses the native Kubernetes reconciliation loop to manage your external cloud resources.
If you are unfamiliar with the reconciliation loop, think of it as an aggressively helpful, obsessive-compulsive butler. You hand this butler a piece of YAML paper stating that you require a specific storage bucket in a specific region. The butler goes out, builds the bucket, and then stands there staring at it forever. If a rogue developer logs into the cloud console and manually deletes that bucket, the butler simply builds it again before the developer has even finished their morning coffee. It is relentless, slightly unnerving, and exactly what you want to keep your infrastructure in check.
Because Crossplane lives inside Kubernetes, you do not need to run a separate pipeline just to execute an infrastructure plan. The cluster itself is the engine. You declare what you want, and the cluster makes reality match your desires.
The anatomy of a multi-cloud combo meal
To understand how this actually works without getting bogged down in endless documentation, you only need to understand three main concepts.
First, you have Providers. These are the translator modules. You install the AWS Provider, the Azure Provider, or the Google Cloud Provider, and suddenly your Kubernetes cluster knows how to speak their specific dialects.
Next, you have Managed Resources. These are the raw ingredients. A single virtual machine, a single virtual network, or a single database instance. You can deploy these directly, but asking a developer to configure twenty different Managed Resources just to get a working application is like handing them a live chicken, a sack of flour, and telling them to make a sandwich.
This brings us to the real magic of Crossplane, which is the Composite Resource.
Composite Resources allow you to bundle all those raw ingredients into a single, easy-to-digest package. It is the infrastructure equivalent of a fast-food drive-through. A developer does not need to know about subnets, security groups, or routing tables. They just submitted a claim for a “Standard Web Database” value meal. Crossplane takes that simple request and translates it into the complex web of resources required behind the scenes.
Looking at the code without falling asleep
To prove that this is not just theoretical nonsense, let us look at what it takes to command two completely different cloud providers from the exact same place.
Normally, doing this requires switching between different tools, authenticating multiple times, and praying you do not execute the wrong command in the wrong terminal. With Crossplane, you just throw your YAML files into the cluster.
Here is a sanitized, totally harmless example of how you might ask AWS for a storage bucket.
And right next to it, in the exact same directory, you can drop this snippet to demand a Resource Group from Azure.
apiVersion: azure.upbound.io/v1beta1
kind: ResourceGroup
metadata:
  name: rg-marketing-dev-01
spec:
  forProvider:
    location: West Europe
  providerConfigRef:
    name: azure-default-provider
You apply these manifests, and Crossplane handles the authentication, the API calls, and the aggressive babysitting of the resources. No Terraform state file is required. It is completely stateless GitOps magic.
The ugly truth about operating at scale
Of course, getting rid of the state file is like going to a music festival without a cell phone. It sounds incredibly liberating until you lose your friends and cannot find your way home.
Operating Crossplane at scale is not always a walk in the park. When things go wrong during provisioning, and they absolutely will go wrong, you do not get a neatly formatted error summary. Because there is no central state file to reference, finding out why a resource failed requires interrogating the Kubernetes API directly.
You type a command to check the status of your resources, and the cluster vomits a massive wall of text onto your screen. It is like trying to find a typo in a phone book while someone shouts at you in a foreign language. Running multiple kubectl commands just to figure out why an Azure database refused to spin up gets very old, very fast.
To survive this chaos, you cannot rely on manual terminal commands. You must pair Crossplane with a dedicated GitOps tool like ArgoCD or FluxCD.
These tools act as the adult in the room. They keep track of what was actually deployed, provide a visual dashboard, and translate the cluster’s internal panic into something a human being can actually read. They give you the visibility that Crossplane lacks out of the box.
Ultimately, moving to Crossplane is a paradigm shift. It requires letting go of the comfortable, procedural workflows of traditional infrastructure as code and embracing the chaotic, eventual consistency of Kubernetes. It has a learning curve that might make you pull your hair out initially, but once you set up your Composite Resources and your GitOps pipelines, you will never want to go back to juggling state files again.