Let us consider the cranium of the modern Cloud Architect. It is a finite biological container, roughly the size of a cantaloupe, filled with a squishy mass of fat and water. Yet, the tech industry operates under the hallucination that this cantaloupe can effortlessly absorb the entire AWS service catalog updates before your morning coffee. Trying to ingest the sheer volume of new DevOps tooling is a lot like watching a python try to swallow a double-door refrigerator. It is structurally impossible, deeply uncomfortable to witness, and usually ends with someone needing medical attention. We are practically obligated to evolve constantly, but our neurological hard drives have strict, unyielding limits.
The biological absurdity of keeping up with the CNCF landscape
The concept of “continuous improvement” in IT often feels less like an inspirational corporate poster and more like a slightly sadistic evolutionary mandate. You finally understand the esoteric routing logic of your Kubernetes networking setup. Your heart rate settles. You feel peace. Then, a cheerful newsletter arrives to inform you that your setup is obsolete and someone has thrown a brand new service mesh at your head.
The exhaustion you feel is not a character flaw. It is a standard biological response to an ecosystem that mutates faster than a flu virus in a crowded airport. Our brains were optimized for remembering which berries are poisonous, not for tracking the depreciation schedule of Helm charts.
Stop eating the trendy vegetables you hate
Then there is the fear of missing out, or FOMO, which drives otherwise rational engineers to do deeply irrational things. Let us be brutally honest here. If you absolutely despise Javascript or feel a physical wave of nausea when looking at a shiny new frontend framework, do not force yourself to learn them just because they are trending on Hacker News.
Trying to master disciplines outside your actual interests is like forcing a housecat to take up scuba diving. The cat will hate it, it will do a terrible job, and everyone involved will end up bleeding. Protect your cognitive load with ruthless aggression. As a DevOps professional, you have permission to focus solely on the infrastructure pipelines and Linux kernel quirks that actually bring you joy. Leave the trendy stuff to the people who actually like it.
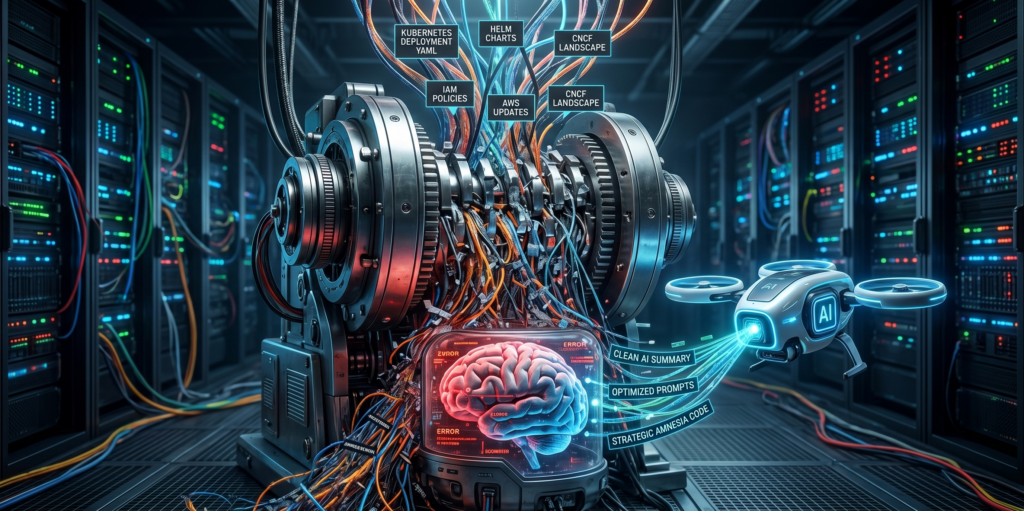
Enter the hyperactive, infinitely patient robot intern
This brings us to the survival strategy. Artificial intelligence is often pitched as an omniscient overlord coming for our jobs. Right now, however, it is much more useful to view it as a hyperactive, infinitely patient intern. These LLMs exist to do the dirty work our cantaloupe brains reject.
They can read the soul-crushing, poorly translated documentation you desperately want to avoid. You can feed a brutal 50-page technical manual on IAM policies into an AI tool and instruct it to spit out a concise summary directly in your terminal. Or better yet, tell it to explain the concepts to you like you are a tired sysadmin who just wants to go home and play with their Mac. It saves hours of mental decay.
Curating your own survival kit
The trick is learning how to interrogate the AI properly. You do not just ask it “what is new in Terraform.” You demand it to extract the protein from the learning material and throw away the useless fat. You can ask it to summarize release notes, generate highly specific flashcards, or even act as a mock interviewer to test your knowledge on specific CI/CD pipelines before a migration. You are outsourcing the most painful parts of the learning curve to a machine that cannot feel pain or boredom.
The fine art of ignoring things
Ultimately, surviving this industry requires a liberating realization. You simply cannot know everything, and attempting to do so is a biological folly. To truly master the fine art of ignoring things, you need to implement a few practical, slightly ruthless habits.
First, practice strategic amnesia. Stop trying to memorize syntax. If an AI can generate the boilerplate YAML for a Kubernetes deployment in three seconds, your brain should actively refuse to store that information. Treat syntax like a disposable coffee cup; use it once and throw it away.
Second, stop hoarding documentation and start hoarding prompts. Your personal knowledge base should not be a graveyard of unread PDFs. It should be a collection of highly tuned, tested instructions that you can feed into an LLM to get exactly what you need, when you need it. Think of them as spells to summon your robot intern.
Third, politely decline the buffet. When a vendor announces a revolutionary new tool that solves a problem you do not actually have, just nod, smile, and walk away. Your cognitive load is precious cargo. Do not fill the cargo bay with garbage.
The ultimate architectural achievement is not memorizing every obscure command line flag. It is building a well structured mind that understands the core principles and knows exactly how to extract the rest of the answers from an AI assistant. Let the machines hold the heavy encyclopedias. We need our brain space for the truly important mysteries, like figuring out why the production database just mysteriously vanished.