For the longest time, communication on the web has been a painfully formal affair. It’s like sending a letter. Your browser meticulously writes a request, sends it off via the postal service (HTTP), and then waits. And waits. Eventually, the server might write back with an answer. If you want to know if anything has changed five seconds later, you have to send another letter. It’s slow, it’s inefficient, and frankly, the postman is starting to give you funny looks.
This constant pestering, “Anything new? How about now? Now?”, is the digital equivalent of a child on a road trip asking, “Are we there yet?” It’s called polling, and it’s the clumsy foundation upon which much of the old web was built. For applications that need to feel alive, this just won’t do.
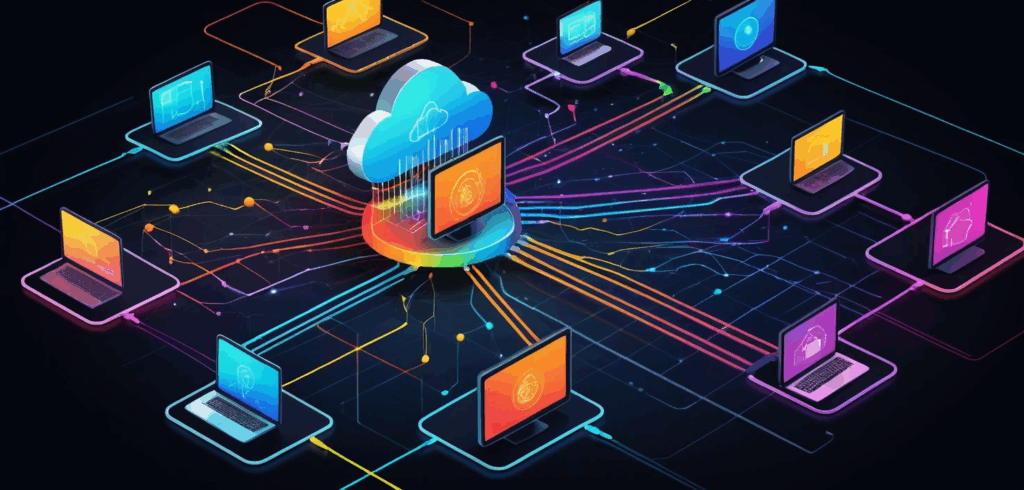
What if, instead of sending a flurry of letters, we could just open a phone line directly to the server? A dedicated, always-on connection where both sides can just shout information at each other the moment it happens. That, in a nutshell, is the beautiful, chaotic, and nonstop chatter of WebSockets. It’s the technology that finally gave our distributed systems a voice.
The secret handshake that starts the party
So how do you get access to this exclusive, real-time conversation? You can’t just barge in. You have to know the secret handshake.
The process starts innocently enough, with a standard HTTP request. It looks like any other request, but it carries a special, almost magical, header: Upgrade: websocket. This is the client subtly asking the server, “Hey, this letter-writing thing is a drag. Can we switch to a private line?”
If the server is cool, and equipped for a real conversation, it responds with a special status code, 101 Switching Protocols. This isn’t just an acknowledgment; it’s an agreement. The server is saying, “Heck yes. The formal dinner party is over. Welcome to the after-party.” At that moment, the clumsy, transactional nature of HTTP is shed like a heavy coat, and the connection transforms into a sleek, persistent, two-way WebSocket tunnel. The phone line is now open.
So what can we do with all this chatter?
Once you have this open line, the possibilities become far more interesting than just fetching web pages. You can build systems that breathe.
The art of financial eavesdropping
Think of a stock trading platform. With HTTP, you’d be that sweaty-palmed investor hitting refresh every two seconds, hoping to catch a price change. With WebSockets, the server just whispers the new prices in your ear the microsecond they change. It’s the difference between reading yesterday’s newspaper and having a live feed from the trading floor piped directly into your brain.
Keeping everyone on the same page literally
Remember the horror of emailing different versions of a document back and forth? “Report_Final_v2_Johns_Edits_Final_FINAL.docx”. Collaborative tools like Google Docs killed that nightmare, and WebSockets were the murder weapon. When you type, your keystrokes are streamed to everyone else in the document instantly. It’s a seamless, shared consciousness, not a series of disjointed monologues.
Where in the world is my taxi
Ride-sharing apps like Uber would be a farce without a live map. You don’t want a “snapshot” of where your driver was 30 seconds ago; you want to see that little car icon gliding smoothly toward you. WebSockets provide that constant stream of location data, turning a map from a static picture into a living, moving window.
When the conversation gets too loud
Of course, hosting a party where a million people are all talking at once isn’t exactly a walk in the park. This is where our brilliant WebSocket-powered dream can turn into a bit of a logistical headache.
A server that could happily handle thousands of brief HTTP requests might suddenly break into a cold sweat when asked to keep tens of thousands of WebSocket phone lines open simultaneously. Each connection consumes memory and resources. It’s like being a party host who promised to have a deep, meaningful conversation with every single guest, all at the same time. Eventually, you’re just going to collapse from exhaustion.
And what happens if the line goes dead? A phone can be hung up, but a digital connection can just… fade into the void. Is the client still there, listening quietly? Or did their Wi-Fi die mid-sentence? To avoid talking to a ghost, servers have to periodically poke the client with a ping message. If they get a pong back, all is well. If not, the server sadly hangs up, freeing the line for someone who actually wants to talk.
How to be a good conversation host
Taming this beast requires a bit of cleverness. You can’t just throw one server at the problem and hope for the best.
Load balancers become crucial, but they need to be smarter. A simple load balancer that just throws requests at any available server is a disaster for WebSockets. It’s like trying to continue a phone conversation while the operator keeps switching you to a different person who has no idea what you were talking about. You need “sticky sessions,” which is a fancy way of saying the load balancer is smart enough to remember which server you were talking to and keeps you connected to it.
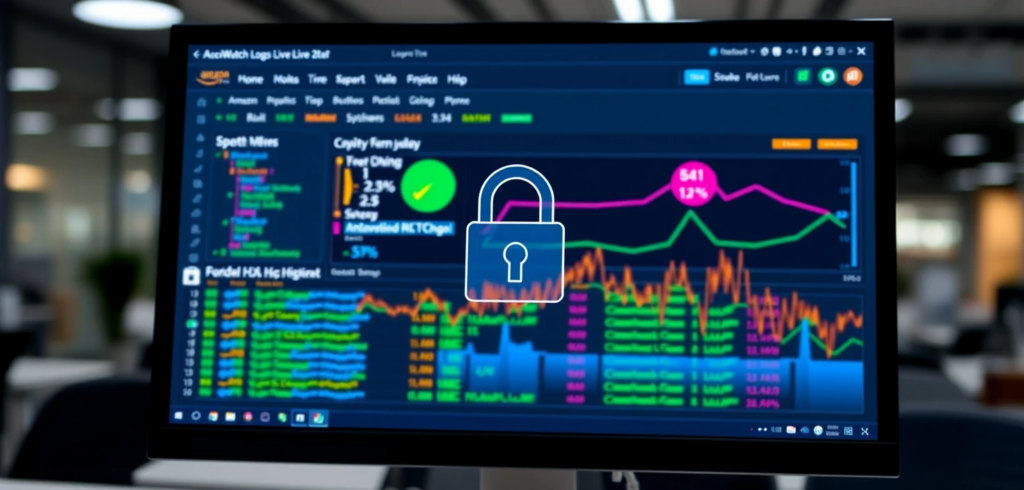
Security also gets a fun new twist. An always-on connection is a wonderfully persistent doorway into your system. If you’re not careful about who you’re talking to and what they’re saying (WSS, the secure version, is non-negotiable), you might find you’ve invited a Trojan horse to your party.
A world that talks back
So, no, WebSockets aren’t just another tool in the shed. They represent a philosophical shift. It’s the moment we stopped treating the web like a library of dusty, static books and started treating it like a bustling, chaotic city square. We traded the polite, predictable, and frankly boring exchange of letters for the glorious, unpredictable mess of a real-time human conversation.
It means our applications can now have a pulse. They can be surprised, they can interrupt, and they can react with the immediacy of a startled cat. Building these living systems is certainly noisier and requires a different kind of host, one who’s part traffic cop and part group therapist. But by embracing the chaos, we create experiences that don’t just respond; they engage, they live. And isn’t building a world that actually talks back infinitely more fun?