Let’s talk about the cloud, specifically, the tangled web of networks we build inside AWS. You spin up your Virtual Private Clouds (VPCs), toss in some subnets, sprinkle in a few security groups, configure those route tables, and before you know it, you’ve got a more complex network than a Rube Goldberg machine. Everything works great… until it doesn’t. A connection fails, an application times out, and you’re left scratching your head. Where do you even begin to troubleshoot?
This is the exact headache that AWS Reachability Analyzer is designed to cure. It is not the most known tool in the AWS toolbox, but believe me, it’s a lifesaver when diagnosing network connectivity issues. This article will explore what Reachability Analyzer is, how this handy tool works its magic, and why you should use it to keep your AWS network humming along smoothly.

What exactly is AWS Reachability Analyzer?
So, what’s the deal with Reachability Analyzer? Think of it as your network detective. It’s a configuration analysis tool that lets you test the connectivity between a source and a destination within your AWS environment. The beauty of it is that it doesn’t send any live traffic. Instead, it does something much smarter.
This nifty tool analyzes your network configuration, your security groups, Network Access Control Lists (NACLs), route tables, and all that jazz. It then builds a virtual model of your network and simulates the path that traffic would take. This way it determines whether packets starting their journey at the source could reach their intended destination.
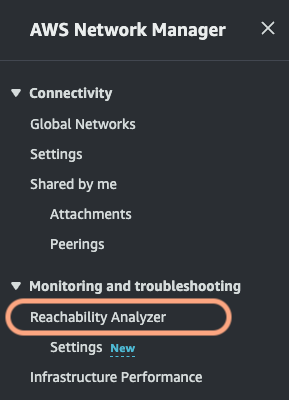
Reachability Analyzer is part of the VPC service but tightly integrates with AWS Network Manager. If you’re dealing with a global network spanning multiple regions, Network Manager lets you run these reachability analyses centrally, giving you a bird’s-eye view of connectivity across your entire infrastructure.
It’s essential to understand what Reachability Analyzer doesn’t do. It won’t test your application-level connectivity or tell you anything about latency. It strictly focuses on the network layer, making sure the path is clear, based on your setup. It also does not take into account firewall rules of the OS, or the capacity of the resources to handle the traffic.
The perks of using Reachability Analyzer
Why bother with Reachability Analyzer? Let me break down the key benefits:
- Pinpoint Connectivity Problems Fast: No more endless digging through logs or running manual traceroutes. Reachability Analyzer quickly identifies the root cause of connectivity issues, saving you precious time and frustration.
- Validate Your Network Setup: It helps ensure your network is configured exactly as you intended and that your security policies are correctly enforced.
- Plan Network Changes with Confidence: Before making any changes to your network, you can use Reachability Analyzer to simulate the impact and avoid accidental outages.
- Boost Your Security Posture: By uncovering potential configuration flaws, it helps you strengthen your network’s defenses.
- Easy Peasy to Use: The interface is intuitive. You don’t need to be a networking guru to use it effectively.
- Identify Components Involved: It shows you hop-by-hop the details of the virtual path between the origin and the destination, giving you visibility of the resources involved in the connection.
Reachability Analyzer in Action
Let’s get our hands dirty with some practical examples to see how Reachability Analyzer shines in real-world scenarios:
- Scenario 1 – EC2 Instance Can’t Talk to RDS Database
Your application running on an EC2 instance is throwing a tantrum and can’t connect to your RDS database, even though they’re in the same VPC. Reachability Analyzer to the rescue! You set up an analysis between the EC2 instance’s Elastic Network Interface (ENI) and the RDS instance’s ENI.
Bam! Reachability Analyzer might reveal that the RDS security group is the culprit. It’s not allowing inbound traffic from the EC2 instance’s security group on the database port. The problem is identified, and you can fix the security group rule with surgical precision. - Scenario 2 – Testing Connectivity After Route Table Tweaks
You’ve just modified a route table to direct traffic between two subnets through a firewall. Now you need to be sure that connectivity is still working as expected.
Simply create an analysis between an instance in the source subnet and one in the destination subnet. Reachability Analyzer will show you the complete path, including the hop through the firewall. If there’s a hiccup in the route table or the firewall configuration, you’ll spot it immediately. - Scenario 3 – VPN Connectivity Woes
You’ve set up a VPN connection between your VPC and your on-premise network, but your users are complaining that they can’t access resources on-premise. Time to bring in Reachability Analyzer.
Run an analysis from an instance in your VPC to an IP address of a server in your on-premise network. Reachability Analyzer might show you that your subnet’s route table is missing a route to the on-premise network via the Virtual Private Gateway (VGW). Or maybe there is a problem with the configuration of your VPN tunnel. The results will give you the clues you need to troubleshoot the VPN setup. - Scenario 4 – Transit Gateway Validation
You are using a Transit Gateway to connect multiple VPCs, and you need to verify connectivity between them.
Configure tests between instances in different VPCs attached to the Transit Gateway. Reachability Analyzer will show you if the Transit Gateway route tables are correctly configured and if the VPCs can communicate through the resource. It can also help determine if there are asymmetric routing issues, where traffic flows in one direction but not the other.
How to use Reachability Analyzer
Ready to give it a spin? Here’s a simple step-by-step guide:
- Access the Tool: Head over to the AWS Management Console, navigate to the VPC section, and you’ll find Reachability Analyzer there. Or, if you are using Network Manager, you can find it in that section.
- Create an Analysis:
.- Select your source and destination. This could be an EC2 instance, an ENI, an Internet Gateway, a VPN Gateway, and more.
.- Specify the protocol (TCP or UDP) and optionally, the destination port.
.- If needed and applicable, enter the source IP address or port.
- Run the Analysis: Hit the “Create and run analysis path” button and let Reachability Analyzer do its thing.
- Interpret the Results:
.- The tool will tell you if the destination is “Reachable” or “Not reachable.”
.- If there’s a problem, it will provide a detailed breakdown of the path, showing you exactly which component is blocking the connection and an explanation of why.
- Run the Analysis from Network Manager: If you have a global network, run the reachability analysis from Network Manager for a broader view.
Wrapping Up
AWS Reachability Analyzer is a powerful tool that simplifies network troubleshooting and gives you greater control over your AWS environment. It’s like having X-ray vision for your network. So, next time you encounter a connectivity mystery in your AWS setup, don’t panic. Fire up Reachability Analyzer, and you will have answers in minutes. Try it out, experiment, and unlock the secrets of your network.


