In any professional kitchen, there’s a natural tension. The chefs are driven to create new, exciting dishes, pushing the boundaries of flavor and presentation. Meanwhile, the kitchen manager is focused on consistency, safety, and efficiency, ensuring every plate that leaves the kitchen meets a rigorous standard. When these two functions don’t communicate well, the result is chaos. When they work in harmony, it’s a Michelin-star operation.
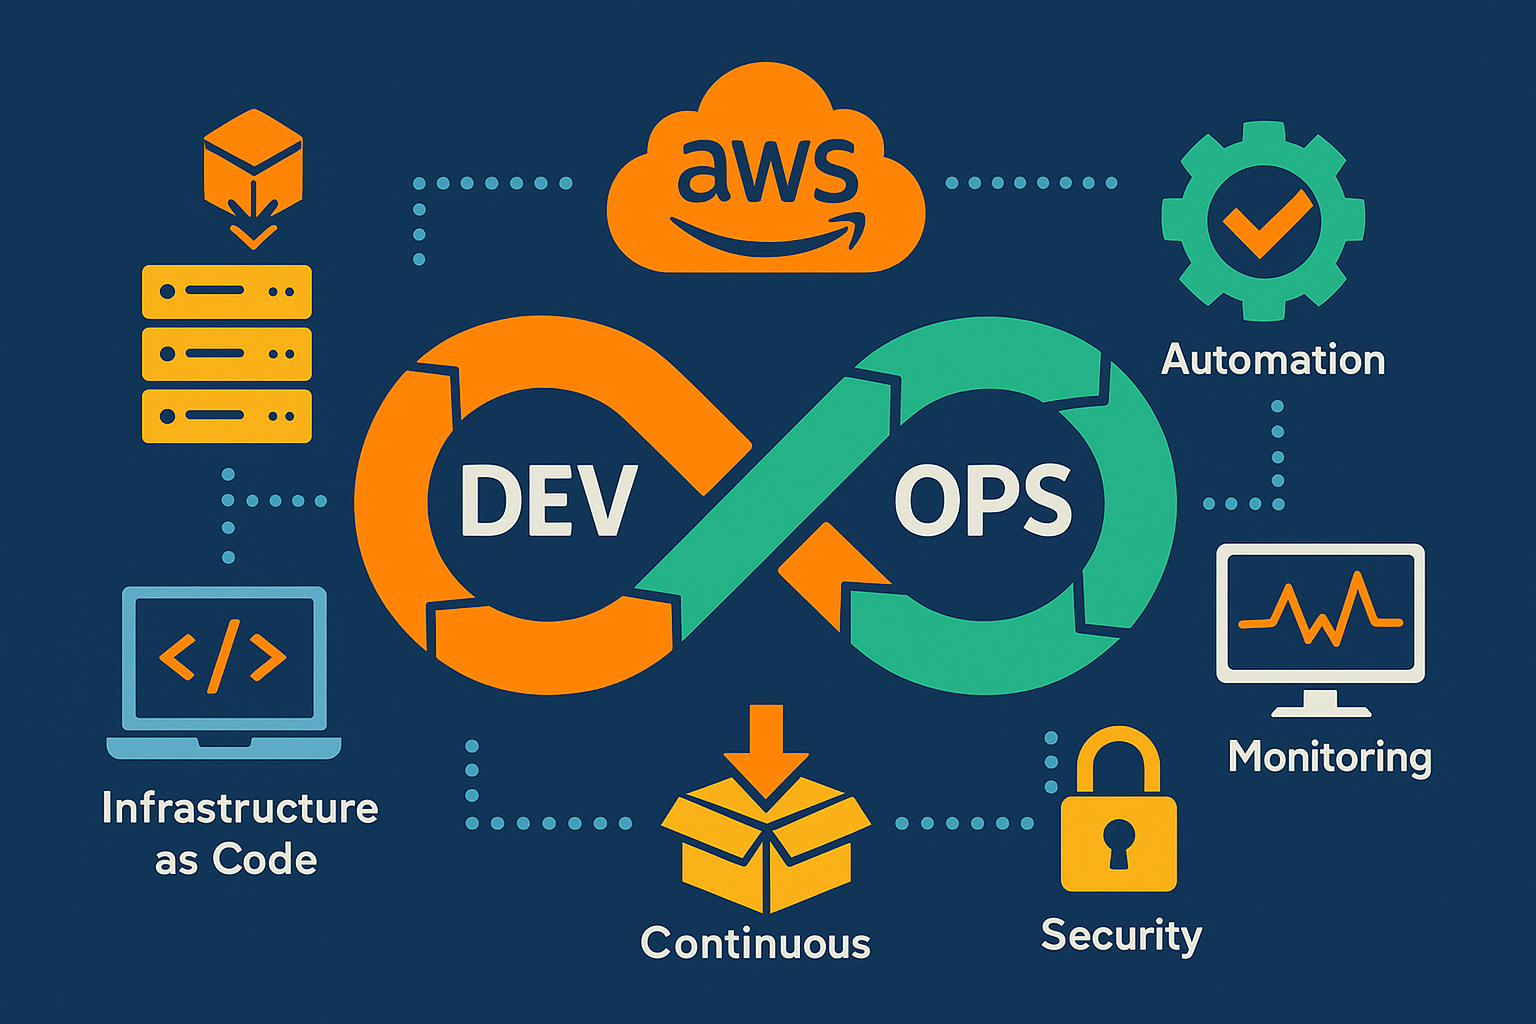
This is the world of software development. Developers are the chefs, driven by innovation. Operations teams are the managers, responsible for stability. DevOps isn’t just a buzzword; it’s the master plan that turns a chaotic kitchen into a model of culinary excellence. And AWS provides the state-of-the-art appliances and workflows to make it happen.
The blueprint for flawless construction
Building infrastructure without a plan is like a construction crew building a house from memory. Every house will be slightly different, and tiny mistakes can lead to major structural problems down the line. Infrastructure as Code (IaC) is the practice of using detailed architectural blueprints for every project.
AWS CloudFormation is your master blueprint. Using a simple text file (in JSON or YAML format), you define every single resource your application needs, from servers and databases to networking rules. This blueprint can be versioned, shared, and reused, guaranteeing that you build an identical, error-free environment every single time. If something goes wrong, you can simply roll back to a previous version of the blueprint, a feat impossible in traditional construction.
To complement this, the Amazon Machine Image (AMI) acts as a prefabricated module. Instead of building a server from scratch every time, an AMI is a perfect snapshot of a fully configured server, including the operating system, software, and settings. It’s like having a factory that produces identical, ready-to-use rooms for your house, cutting setup time from hours to minutes.
The automated assembly line for your code
In the past, deploying software felt like a high-stakes, manual event, full of risk and stress. Today, with a continuous delivery pipeline, it should feel as routine and reliable as a modern car factory’s assembly line.
AWS CodePipeline is the director of this assembly line. It automates the entire release process, from the moment code is written to the moment it’s delivered to the user. It defines the stages of build, test, and deploy, ensuring the product moves smoothly from one station to the next.
Before the assembly starts, you need a secure warehouse for your parts and designs. AWS CodeCommit provides this, offering a private and secure Git repository to store your code. It’s the vault where your intellectual property is kept safe and versioned.
Finally, AWS CodeDeploy is the precision robotic arm at the end of the line. It takes the finished software and places it onto your servers with zero downtime. It can perform sophisticated release strategies like Blue-Green deployments. Imagine the factory rolling out a new car model onto the showroom floor right next to the old one. Customers can see it and test it, and once it’s approved, a switch is flipped, and the new model seamlessly takes the old one’s place. This eliminates the risk of a “big bang” release.
Self-managing environments that thrive
The best systems are the ones that manage themselves. You don’t want to constantly adjust the thermostat in your house; you want it to maintain the perfect temperature on its own. AWS offers powerful tools to create these self-regulating environments.
AWS Elastic Beanstalk is like a “smart home” system for your application. You simply provide your code, and Beanstalk handles everything else automatically: deploying the code, balancing the load, scaling resources up or down based on traffic, and monitoring health. It’s the easiest way to get an application running in a robust environment without worrying about the underlying infrastructure.
For those who need more control, AWS OpsWorks is a configuration management service that uses Chef and Puppet. Think of it as designing a custom smart home system from modular components. It gives you granular control to automate how you configure and operate your applications and infrastructure, layer by layer.
Gaining full visibility of your operations
Operating an application without monitoring is like trying to run a factory from a windowless room. You have no idea if the machines are running efficiently if a part is about to break, or if there’s a security breach in progress.
AWS CloudWatch is your central control room. It provides a wall of monitors displaying real-time data for every part of your system. You can track performance metrics, collect logs, and set alarms that notify you the instant a problem arises. More importantly, you can automate actions based on these alarms, such as launching new servers when traffic spikes.
Complementing this is AWS CloudTrail, which acts as the unchangeable security logbook for your entire AWS account. It records every single action taken by any user or service, who logged in, what they accessed, and when. For security audits, troubleshooting, or compliance, this log is your definitive source of truth.
The unbreakable rules of engagement
Speed and automation are worthless without strong security. In a large company, not everyone gets a key to every room. Access is granted based on roles and responsibilities.
AWS Identity and Access Management (IAM) is your sophisticated keycard system for the cloud. It allows you to create users and groups and assign them precise permissions. You can define exactly who can access which AWS services and what they are allowed to do. This principle of “least privilege”, granting only the permissions necessary to perform a task, is the foundation of a secure cloud environment.
A cohesive workflow not just a toolbox
Ultimately, a successful DevOps culture isn’t about having the best individual tools. It’s about how those tools integrate into a seamless, efficient workflow. A world-class kitchen isn’t great because it has a sharp knife and a hot oven; it’s great because of the system that connects the flow of ingredients to the final dish on the table.
By leveraging these essential AWS services, you move beyond a simple collection of tools and adopt a new operational philosophy. This is where DevOps transcends theory and becomes a tangible reality: a fully integrated, automated, and secure platform. This empowers teams to spend less time on manual configuration and more time on innovation, building a more resilient and responsive organization that can deliver better software, faster and more reliably than ever before.


