Microservices

From Monolith to Microservices, Amazon’s Two-Pizza Team Concept

In the early days of software development, most applications were built using a monolithic architecture. This model, while reliable for small-scale systems, often struggled as applications grew in complexity and user demand. Over time, companies like Amazon found themselves facing significant operational challenges under the weight of their monolithic systems, leading to an evolution in software design, the shift from monoliths to microservices.

This article delves into the reasoning behind this transition and explores why many organizations today are adopting microservices for better agility, scalability, and innovation.

Understanding the Monolithic Architecture

A monolithic application is essentially a single, unified software structure. All the components, whether they are related to the user interface, business logic, or database operations. are bundled into one large codebase. Traditionally, this approach was the most common and familiar to software engineers. It was simple to design, test, and deploy, which made it ideal for smaller applications with minimal complexity.

However, as applications grew in size and scope, the limitations of monolithic systems became apparent. Let’s take a look at an example from Amazon’s history.

Amazon’s Monolithic Beginnings

In the 1990s, Amazon’s bookstore application was built on a monolithic architecture, consisting of a simple web server front end and a database back end. While this model served them well initially, the sheer growth of their business created bottlenecks that couldn’t be easily addressed. With every new feature, the complexity of their system increased, making it harder to release updates without affecting other parts of the application.

Here’s where monoliths begin to struggle:

  • Coordination Complexity: Developers working on different features had to coordinate with one another constantly. If a team wanted to add a new feature or change a database table, they needed to check with every other team that relied on that feature or table. This led to high communication overhead and slowed down innovation.
  • Scaling Issues: Scaling a monolithic system often means scaling the entire application, even if only one part of it is experiencing high demand. This is both inefficient and expensive.
  • Deployment Risk: Since every part of the application is tightly coupled, releasing even a minor update could introduce bugs or break functionality elsewhere. The risks associated with deploying changes were high, leading to a slower pace of delivery.

The Shift Toward Microservices. A Solution for Scale and Agility

By the late 1990s, Amazon realized they needed a new approach to continue scaling their business and innovating at a competitive pace. They introduced the “Distributed Computing Manifesto,” a blueprint for shifting away from the monolithic model toward a more flexible and scalable architecture, microservices.

What are Microservices?

Microservices break down a monolithic application into smaller, independent services, each responsible for a specific piece of functionality. These services communicate through well-defined APIs, allowing them to work together while remaining decoupled from one another.

The core principles that drove Amazon’s transition from monolith to microservices were:

  1. Small, Independent Services: The smaller each service, the more manageable it becomes. Teams working on different services can make changes and deploy them independently without affecting the entire system.
  2. Decoupling Based on Scaling Factors: Instead of decoupling the application based on functions (e.g., web servers vs. database servers), Amazon focused on decoupling based on what parts of the system were impeding agility and speed. This allows for more targeted scaling of only the components that require it.
  3. Independent Operation: Each service operates as its entity. This reduces cross-team coordination, as each service can be developed, tested, and deployed on its own schedule.
  4. APIs Between Services: Communication between services is done through APIs, which ensures that the system remains loosely coupled. Services don’t need to share databases or be aware of each other’s internal workings, which promotes modularity and flexibility.

The Two-Pizza Team Concept

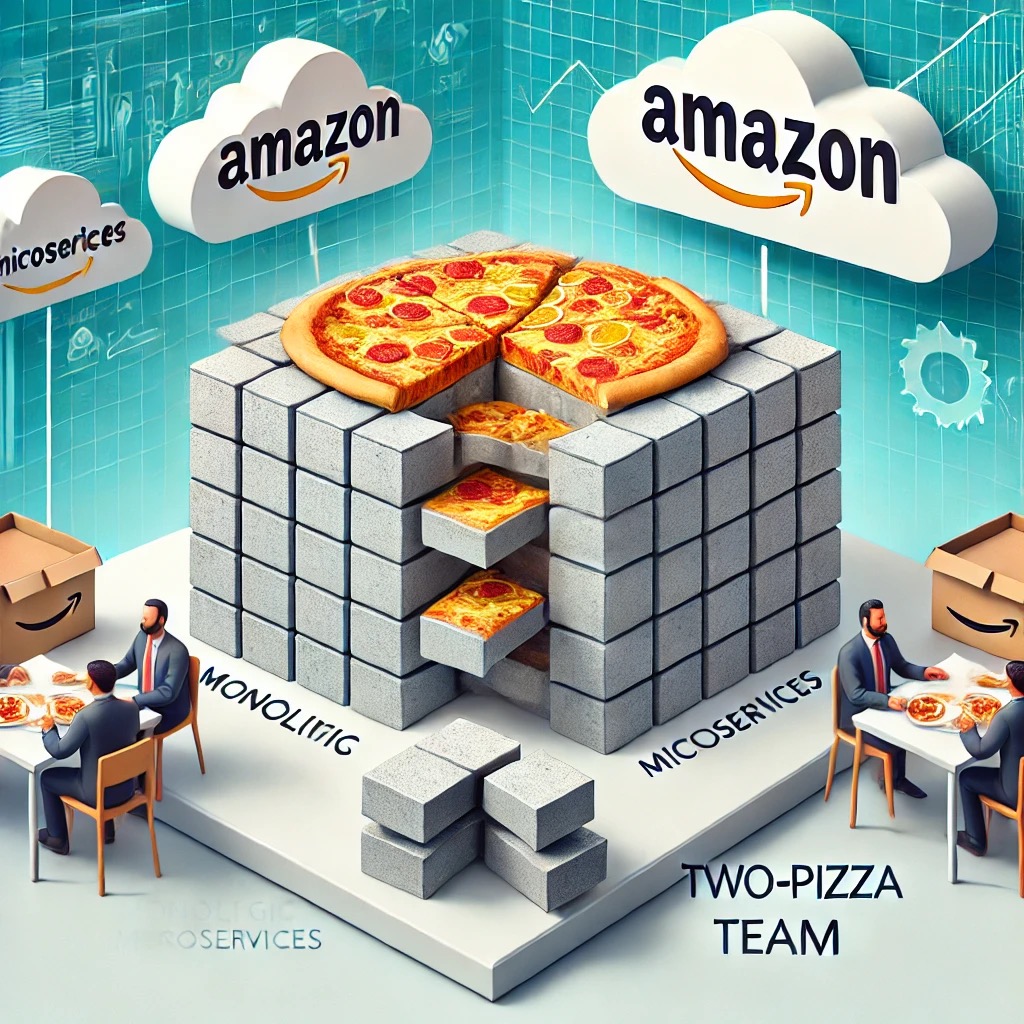
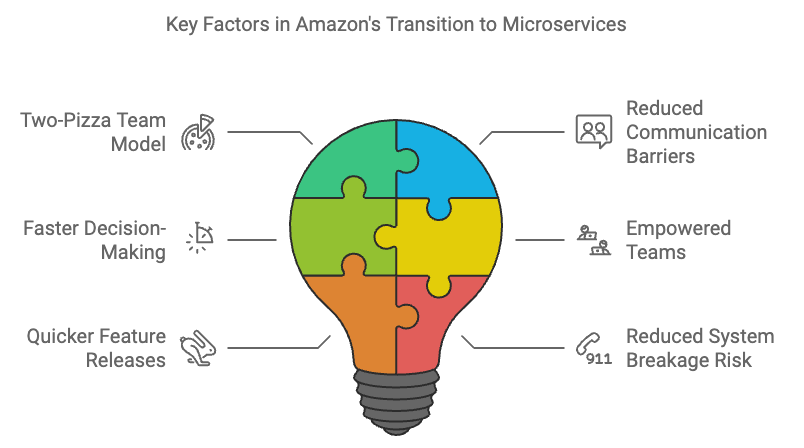
One of the cultural shifts that helped make this transition work at Amazon was the introduction of the “two-pizza team” model. The idea was simple: teams should be small enough to be fed by two pizzas. Smaller teams have fewer communication barriers, which allows them to move faster and make decisions autonomously. Combined with microservices, this empowered Amazon’s teams to release features more quickly and with less risk of breaking the overall system.

The Benefits of Microservices

The shift from monolith to microservices brought several key benefits to Amazon, and many of these benefits apply universally to organizations making the transition today.

  1. Faster Innovation: Since teams no longer have to coordinate every feature release with other teams, they can move faster. This leads to more frequent updates and a shorter time-to-market for new features.
  2. Improved Scalability: Microservices allow you to scale individual components of your application independently. If one service is under heavy load, you can scale only that service, rather than the entire application, reducing both cost and complexity.
  3. Better Fault Isolation: With a monolithic system, a failure in one part of the application can bring down the entire system. In contrast, microservices are isolated from one another, so if one service fails, the others can continue to operate.
  4. Technology Flexibility: In a monolithic system, you’re often limited to a single technology stack. With microservices, each service can use the most appropriate tools and technologies for its specific requirements. This allows for greater experimentation and flexibility in development.

Challenges in Adopting Microservices

While the benefits of microservices are clear, the transition from a monolithic architecture isn’t without its challenges. It’s important to recognize that microservices introduce a new level of operational complexity.

  • Service Coordination: With multiple services running independently, keeping them in sync can become complex. Versioning and maintaining API contracts between services requires careful planning.
  • Monitoring and Debugging: In a microservices architecture, errors and performance issues are often harder to trace. Since each service is decoupled, tracking down the root cause of a problem can involve digging through logs across several services.
  • Cultural Shifts: For organizations used to working in a monolithic environment, shifting to microservices often requires a change in team structure and communication practices. The two-pizza team model is one way to address this, but it requires buy-in at all levels of the organization.

Is Microservices the Right Move?

The transition from monolith to microservices is a journey, not a destination. While microservices offer significant advantages in terms of scalability, speed, and fault tolerance, they aren’t a one-size-fits-all solution. For smaller or less complex applications, a monolithic architecture might still make sense. However, as systems grow in complexity and demand, microservices provide a proven model for handling that growth in a manageable way.

The key takeaway is this: microservices aren’t just about breaking down your application into smaller pieces; they’re about enabling your teams to work more independently and innovate faster. And in today’s competitive software landscape, that speed can make all the difference.

Observability of Distributed Applications, Beyond the Logs

A Journey into Modern Monitoring

In the world of software, we’ve witnessed a fascinating evolution. Applications have transformed from monolithic giants into nimble constellations of microservices. This shift, while empowering, has brought forth a new challenge: the overwhelming deluge of data generated by these distributed systems. Traditional logging, once our trusty guide, now feels like trying to assemble a puzzle with pieces scattered across a vast landscape.

The Puzzle of Modern Applications

Imagine a bustling city. Each microservice is like a building, each with its own story. Logs are akin to the whispers within those walls, offering glimpses into individual activities. But what if we want to understand the city as a whole? How do we grasp the flow of traffic, the interconnectedness of services, and the subtle signs of trouble brewing beneath the surface?

This is where the concept of “observability” shines. It’s more than just collecting logs; it’s about understanding our complex systems holistically. It’s about peering beyond the individual whispers and seeing the symphony of interactions.

Beyond Logs: Metrics and Traces

To truly embrace observability, we must expand our toolkit. Alongside logs, we need two more powerful allies:

  • Metrics: These are the vital signs of our applications, the pulse rate, blood pressure, and temperature. Metrics provide quantitative data like CPU usage, request latency, and error rates. They give us a real-time snapshot of system health, allowing us to detect anomalies and trends. As the saying goes, “Metrics tell us when something went wrong.
  • Traces: Think of these as the GPS trackers of our requests. As a request journeys through our microservices, traces capture its path, the time spent at each stop, and any bottlenecks encountered. This helps us pinpoint the root cause of issues and optimize performance. In essence, “Traces tell us where something went wrong.

The Power of Correlation

But the true magic of observability lies in the correlation of these three pillars. We gain a multi-dimensional view of our systems by weaving together logs, metrics, and traces. When an alert is triggered based on unusual metrics, we can investigate the corresponding traces to see exactly which requests were affected. From there, we can examine the logs of the relevant microservices to understand precisely what went wrong.

This correlation is the key to rapid troubleshooting and proactive problem-solving. It empowers us to move beyond reactive firefighting and into a realm of continuous improvement.

The Observability Toolbox. Prometheus, Grafana, Jaeger and Loki

Now, let’s equip ourselves with the tools of the trade:

  • Prometheus: This is our trusty data collector, like a diligent census taker. It goes from microservice to microservice, gathering up those vital signs – the metrics – and storing them neatly. But it’s more than just a collector; it’s a clever analyst too. It gives us a special language to ask questions about our data and to see patterns and trends emerging from the numbers.
  • Grafana: Imagine a grand control room, with screens glowing with information. That’s Grafana. It takes the raw data, those metrics, and logs, and turns them into beautiful pictures, like a painter turning a blank canvas into a masterpiece. We can see the rise and fall of CPU usage, and the dance of network traffic, all laid out before our eyes.
  • Jaeger: This is our detective’s toolkit, the magnifying glass and fingerprint powder. It follows the trails of requests as they wander through our city of microservices. It shows us where they get stuck, and where they take unexpected turns. By working together with our log collector, it helps us match up those trails with the clues hidden in the logs.
  • Loki: If logs are the whispers of our city, Loki is our trusty stenographer. It captures and stores those whispers, those tiny details that might seem insignificant on their own. But when we correlate them with our metrics and traces, they reveal the secrets of how our city truly functions. Loki is like a time machine for our logs, letting us rewind and replay events to understand what went wrong.

With these four tools in our hands, we become not just architects of our systems, but explorers and detectives. We can see the hidden connections, diagnose the ailments, and ultimately, make our city of microservices run smoother, faster, and more reliably.

The Power of Observability

By adopting observability, we unlock a new level of understanding. We can:

  • Diagnose issues faster: Instead of sifting through endless logs, we can quickly identify the root cause of problems using metrics and traces.
  • Optimize performance: By analyzing the flow of requests, we can pinpoint bottlenecks and fine-tune our systems for optimal efficiency.
  • Proactive monitoring: With real-time alerts based on metrics, we can detect anomalies before they escalate into major incidents.
  • Data-driven decisions: Observability data provides invaluable insights for capacity planning, resource allocation, and architectural improvements.

The Journey Continues

The world of distributed applications is ever-evolving. New technologies and challenges will emerge. But armed with the principles of observability and the right tools, we can navigate this landscape with confidence. We can build systems that are not only resilient and scalable but also deeply understood.

Observability is not a destination; it’s a journey of continuous discovery. By adopting it, we embark on a path of greater insight, better performance, and ultimately, more reliable and user-friendly applications.

Scaling for Success. Cost-Effective Cloud Architectures on AWS

One of the most exciting aspects of cloud computing is the promise of scalability, the ability to expand or contract resources to meet demand. But how do you design an architecture that can handle unexpected traffic spikes without breaking the bank during quieter periods? This question often comes up in AWS Solution Architect interviews, and for good reason. It’s a core challenge that many businesses face when moving to the cloud. Let’s explore some AWS services and strategies that can help you achieve both scalability and cost efficiency.

Building a Dynamic and Cost-Aware AWS Architecture

Imagine your application is like a bustling restaurant. During peak hours, you need a full staff and all tables ready. But during off-peak times, you don’t want to be paying for idle resources. Here’s how we can translate this concept into a scalable AWS architecture:

  1. Auto Scaling Groups (ASGs): Think of ASGs as your restaurant’s staffing manager. They automatically adjust the number of EC2 instances (your servers) based on predefined rules. If your website traffic suddenly spikes, ASGs will spin up additional instances to handle the load. When traffic dies down, they’ll scale back, saving you money. You can even combine ASGs with Spot Instances for even greater cost savings.
  2. Amazon EC2 Spot Instances: These are like the temporary staff you might hire during a particularly busy event. Spot Instances let you take advantage of unused EC2 capacity at a much lower cost. If your demand is unpredictable, Spot Instances can be a great way to save money while ensuring you have enough resources to handle peak loads.
  3. Amazon Lambda: Lambda is your kitchen staff that only gets paid when they’re cooking, and they’re really good at their job, they can whip up a dish in under 15 minutes! It’s a serverless compute service that runs your code in response to events (like a new file being uploaded or a database change). You only pay for the compute time you actually use, making it ideal for sporadic or unpredictable workloads.
  4. AWS Fargate: Fargate is like having a catering service handle your entire kitchen operation. It’s a serverless compute engine for containers, meaning you don’t have to worry about managing the underlying servers. Fargate automatically scales your containerized applications based on demand, and you only pay for the resources your containers consume.

How the Pieces Fit Together

Now, let’s see how these services can work together in harmony:

  • Core Application on EC2 with Auto Scaling: Your main application might run on EC2 instances within an Auto Scaling Group. You can configure this group to monitor the CPU utilization of your servers and automatically launch new instances if the average CPU usage reaches a threshold, such as 75% (this is known as a Target Tracking Scaling Policy). This ensures you always have enough servers running to handle the current load, even during unexpected traffic spikes.
  • Spot Instances for Cost Optimization: To save costs, you could configure your Auto Scaling Group to use Spot Instances whenever possible. This allows you to take advantage of lower prices while still scaling up when needed. Importantly, you’ll also want to set up a recovery policy within your Auto Scaling Group. This policy ensures that if Spot Instances are not available (due to high demand or price fluctuations), your Auto Scaling Group will automatically launch On-Demand Instances instead. This way, you can reliably meet your application’s resource needs even when Spot Instances are unavailable.
  • Lambda for Event-Driven Tasks: Lambda functions excel at handling event-driven tasks that don’t require a constantly running server. For example, when a new image is uploaded to your S3 bucket, you can trigger a Lambda function to automatically resize it or convert it to a different format. Similarly, Lambda can be used to send notifications to users when certain events occur in your application, such as a new order being placed or a payment being processed. Since Lambda functions are only active when triggered, they can significantly reduce your costs compared to running dedicated EC2 instances for these tasks.
  • Fargate for Containerized Microservices:  If your application is built using microservices, you can run them in containers on Fargate. This eliminates the need to manage servers and allows you to scale each microservice independently. By decoupling your microservices and using Amazon Simple Queue Service (SQS) queues for communication, you can ensure that even under heavy load, all requests will be handled and none will be lost. For applications where the order of operations is critical, such as financial transactions or order processing, you can use FIFO (First-In-First-Out) SQS queues to maintain the exact order of messages.
  1. Monitoring and Optimization:  Imagine having a restaurant manager who constantly monitors how busy the restaurant is, how much food is being wasted, and how satisfied the customers are. This is what Amazon CloudWatch does for your AWS environment. It provides detailed metrics and alarms, allowing you to fine-tune your scaling policies and optimize your resource usage. With CloudWatch, you can visualize the health and performance of your entire AWS infrastructure at a glance through intuitive dashboards and graphs. These visualizations make it easy to identify trends, spot potential issues, and make informed decisions about resource allocation and optimization.

The Outcome, A Satisfied Customer and a Healthy Bottom Line

By combining these AWS services and strategies, you can build a cloud architecture that is both scalable and cost-effective. This means your application can gracefully handle unexpected traffic spikes, ensuring a smooth user experience even during peak demand. At the same time, you won’t be paying for idle resources during quieter periods, keeping your cloud costs under control.

Final Analysis

Designing for scalability and cost efficiency is a fundamental aspect of cloud architecture. By leveraging AWS services like Auto Scaling, EC2 Spot Instances, Lambda, and Fargate, you can create a dynamic and responsive environment that adapts to your application’s needs. Remember, the key is to understand your workload patterns and choose the right tools for the job. With careful planning and the right AWS services, you can build a cloud architecture that is both powerful and cost-effective, setting your business up for success in the cloud and in the restaurant. 😉

The Power of Event-Driven Scaling in Kubernetes: KEDA

Kubernetes is a compelling platform for managing containerized applications but can be complex. One area where Kubernetes shines is its ability to scale applications based on demand. However, traditional scaling methods in Kubernetes might not always be the most efficient, especially when dealing with event-driven workloads. This is where KEDA (Kubernetes Event-Driven Autoscaling) comes into play.

What is KEDA?

KEDA stands for Kubernetes Event-Driven Autoscaling. It is an open-source component that allows Kubernetes to scale applications based on events. This means that instead of only scaling your applications based on metrics like CPU or memory usage, you can scale them based on specific events or external metrics such as the number of messages in a queue, the rate of requests to an endpoint, or custom metrics from various sources.

Key Features and Functionalities

  1. Event-Driven Scaling: KEDA enables scaling based on the number of events that need to be processed, rather than just CPU or memory metrics.
  2. Lightweight Component: KEDA is designed to be a lightweight addition to your Kubernetes cluster, ensuring it doesn’t interfere with other components.
  3. Flexibility: It integrates seamlessly with Kubernetes’ Horizontal Pod Autoscaler (HPA), extending its functionality without overwriting or duplicating it.
  4. Built-In Scalers: KEDA comes with over 50 built-in scalers for various platforms, including cloud services, databases, messaging systems, telemetry systems, CI/CD tools, and more.
  5. Support for Multiple Workloads: It can scale various types of workloads, including deployments, jobs, and custom resources.
  6. Scaling to Zero: KEDA allows scaling down to zero pods when there are no events to process, optimizing resource usage and reducing costs.
  7. Extensibility: You can use community-maintained or custom scalers to support unique event sources.
  8. Provider-Agnostic: KEDA supports event triggers from a wide range of cloud providers and products.
  9. Azure Functions Integration: It allows you to run and scale Azure Functions in Kubernetes for production workloads.
  10. Resource Optimization: KEDA helps build sustainable platforms by optimizing workload scheduling and scaling to zero when not needed.

Advantages of Using KEDA

  1. Efficiency: By scaling based on actual events, KEDA ensures that your application only uses the resources it needs, improving efficiency and potentially reducing costs.
  2. Flexibility: With support for a wide range of event sources and integration with HPA, KEDA provides a flexible scaling solution.
  3. Simplicity: It simplifies the configuration of event-driven scaling in Kubernetes, abstracting the complexities of integrating different event sources.
  4. Seamless Integration: KEDA works well with existing Kubernetes components and can be easily integrated into your current infrastructure.

Optimizing a Retail Application

Imagine you are managing an online retail application. During normal hours, traffic is relatively steady, but during sales events, the number of orders can spike dramatically. Here’s how KEDA can help:

  1. Order Processing: Your application uses a message queue to handle order processing. Normally, the queue has a manageable number of messages, but during a sale, the number of messages can skyrocket.
  2. Scaling with KEDA: KEDA can monitor the message queue and automatically scale the order processing service based on the number of messages. This ensures that as more orders come in, additional instances of the service are started to handle the load, preventing delays and improving customer experience.
  3. Cost Management: Once the sale is over and the message count drops, KEDA will scale down the service, ensuring that you are not paying for unused resources.
  4. Scaling to Zero: When there are no orders to process, KEDA can scale the order processing service down to zero pods, further reducing costs.

In a few words

KEDA is a powerful tool that brings the benefits of event-driven scaling to Kubernetes. Its ability to scale applications based on events makes it an ideal choice for dynamic workloads. By integrating with a variety of event sources and providing a simple yet flexible way to configure scaling, KEDA helps optimize resource usage, enhance performance, and manage costs effectively. Whether you’re running an e-commerce platform, processing data streams, or managing microservices, KEDA can help ensure your applications are always running efficiently.

In essence, KEDA is about making your applications responsive to real-world events, ensuring they are always ready to meet demand without wasting resources. It’s a valuable addition to any Kubernetes toolkit, offering a smarter, more efficient way to handle scaling.

Understanding AWS VPC Lattice

Amazon Web Services (AWS) constantly innovates to make cloud computing more efficient and user-friendly. One of their newer services, AWS VPC Lattice, is designed to simplify networking in the cloud. But what exactly is AWS VPC Lattice, and how can it benefit you?

What is AWS VPC Lattice?

AWS VPC Lattice is a service that helps you manage the communication between different parts of your applications. Think of it as a traffic controller for your cloud infrastructure. It ensures that data moves smoothly and securely between various services and resources in your Virtual Private Cloud (VPC).

Key Features of AWS VPC Lattice

  1. Simplified Networking: AWS VPC Lattice makes it easier to connect different parts of your application without needing complex network configurations. You can manage communication between microservices, serverless functions, and traditional applications all in one place.
  2. Security: It provides built-in security features like encryption and access control. This means that data transfers are secure, and you can easily control who can access specific resources.
  3. Scalability: As your application grows, AWS VPC Lattice scales with it. It can handle increasing traffic and ensure your application remains fast and responsive.
  4. Visibility and Monitoring: The service offers detailed monitoring and logging, so you can monitor your network traffic and quickly identify any issues.

Benefits of AWS VPC Lattice

  • Ease of Use: By simplifying the process of connecting different parts of your application, AWS VPC Lattice reduces the time and effort needed to manage your cloud infrastructure.
  • Improved Security: With robust security features, you can be confident that your data is protected.
  • Cost-Effective: By streamlining network management, you can potentially reduce costs associated with maintaining complex network setups.
  • Enhanced Performance: Optimized communication paths lead to better performance and a smoother user experience.

VPC Lattice in the real world

Imagine you have an e-commerce platform with multiple microservices: one for user authentication, one for product catalog, one for payment processing, and another for order management. Traditionally, connecting these services securely and efficiently within a VPC can be complex and time-consuming. You’d need to configure multiple security groups, manage network access control lists (ACLs), and set up inter-service communication rules manually.

With AWS VPC Lattice, you can set up secure, reliable connections between these microservices with just a few clicks, even if these services are spread across different AWS accounts. For example, when a user logs in (user authentication service), their request can be securely passed to the product catalog service to display products. When they make a purchase, the payment processing service and order management service can communicate seamlessly to complete the transaction.

Using a standard VPC setup for this scenario would require extensive manual configuration and constant management of network policies to ensure security and efficiency. AWS VPC Lattice simplifies this by automatically handling the networking configurations and providing a centralized way to manage and secure inter-service communications. This not only saves time but also reduces the risk of misconfigurations that could lead to security vulnerabilities or performance issues.

In summary, AWS VPC Lattice offers a streamlined approach to managing complex network communications across multiple AWS accounts, making it significantly easier to scale and secure your applications.

In a few words

AWS VPC Lattice is a powerful tool that simplifies cloud networking, making it easier for developers and businesses to manage their applications. Whether you’re running a small app or a large-scale enterprise solution, AWS VPC Lattice can help you ensure secure, efficient, and scalable communication between your services. Embrace this new service to streamline your cloud operations and focus more on what matters most, building great applications.

Kubernetes Annotations – The Overlooked Key to Better DevOps

In the intricate universe of Kubernetes, where containers and services dance in a meticulously orchestrated ballet of automation and efficiency, there lies a subtle yet potent feature often shadowed by its more conspicuous counterparts: annotations. This hidden layer, much like the cryptic notes in an ancient manuscript, holds the keys to understanding, managing, and enhancing the Kubernetes realm.

Decoding the Hidden Language

Imagine you’re an explorer in the digital wilderness of Kubernetes, charting out unexplored territories. Your map is dotted with containers and services, each marked by basic descriptions. Yet, you yearn for more – a deeper insight into the lore of each element. Annotations are your secret script, a way to inscribe additional details, notes, and reminders onto your Kubernetes objects, enriching the story without altering its course.

Unlike labels, their simpler cousins, annotations are the detailed annotations in the margins of your map. They don’t influence the plot directly but offer a richer narrative for those who know where to look.

The Craft of Annotations

Annotations are akin to the hidden annotations in an ancient text, where each note is a key-value pair embedded in the metadata of Kubernetes objects. They are the whispered secrets between the lines, enabling you to tag your digital entities with information far beyond the visible spectrum.

Consider a weary traveler, a Pod named ‘my-custom-pod’, embarking on a journey through the Kubernetes landscape. It carries with it hidden wisdom:

apiVersion: v1
kind: Pod
metadata:
  name: my-custom-pod
  annotations:
    # Custom annotations:
    app.kubernetes.io/component: "frontend" # Identifies the component that the Pod belongs to.
    app.kubernetes.io/version: "1.0.0" # Indicates the version of the software running in the Pod.
    # Example of an annotation for configuration:
    my-application.com/configuration: "custom-value" # Can be used to store any kind of application-specific configuration.
    # Example of an annotation for monitoring information:
    my-application.com/last-update: "2023-11-14T12:34:56Z" # Can be used to track the last time the Pod was updated.

These annotations are like the traveler’s diary entries, invisible to the untrained eye but invaluable to those who know of their existence.

The Purpose of Whispered Words

Why whisper these secrets into the ether? The reasons are as varied as the stars:

  • Chronicles of Creation: Annotations hold tales of build numbers, git hashes, and release IDs, serving as breadcrumbs back to their origins.
  • Secret Handshakes: They act as silent signals to controllers and tools, orchestrating behavior without direct intervention.
  • Invisible Ink: Annotations carry covert instructions for load balancers, ingress controllers, and other mechanisms, directing actions unseen.

Tales from the Annotations

The power of annotations unfolds in their stories. A deployment annotation may reveal the saga of its version and origin, offering clarity in the chaos. An ingress resource, tagged with a special annotation, might hold the key to unlocking a custom authentication method, guiding visitors through hidden doors.

Guardians of the Secrets

With great power comes great responsibility. The guardians of these annotations must heed the ancient wisdom:

  • Keep the annotations concise and meaningful, for they are not scrolls but whispers on the wind.
  • Prefix them with your domain, like marking your territory in the digital expanse.
  • Document these whispered words, for a secret known only to one is a secret soon lost.

In the sprawling narrative of Kubernetes, where every object plays a part in the epic, annotations are the subtle threads that weave through the fabric, connecting, enhancing, and enriching the tale. Use them, and you will find yourself not just an observer but a master storyteller, shaping the narrative of your digital universe.

Demystifying Dapr: The Game-Changer for Kubernetes Microservices

As the landscape of software development continues to transform, the emergence of microservices architecture stands as a pivotal innovation. Yet, this power is accompanied by a notable increase in complexity. To navigate this, Dapr (Distributed Application Runtime) emerges as a beacon for developers in the microservices realm, offering streamlined solutions for the challenges of distributed systems. Let’s dive into the world of Dapr, explore its setup and configuration, and reveal how it reshapes Kubernetes deployments

What is Dapr?

Imagine a world where building microservices is as simple as building a single-node application. That’s the world Dapr is striving to create. Dapr is an open-source, portable, event-driven runtime that makes it easy for developers to build resilient, stateless, and stateful applications that run on the cloud and edge. It’s like having a Swiss Army knife for developers, providing a set of building blocks that abstract away the complexities of distributed systems.

Advantages of Using Dapr in Kubernetes

Dapr offers a plethora of benefits for Kubernetes environments:

  • Language Agnosticism: Write in the language you love, and Dapr will support it.
  • Simplified State Management: Dapr manages stateful services with ease, making it a breeze to maintain application state.
  • Built-in Resilience: Dapr’s runtime is designed with the chaos of distributed systems in mind, ensuring your applications are robust and resilient.
  • Event-Driven Capabilities: Embrace the power of events without getting tangled in the web of event management.
  • Security and Observability: With Dapr, you get secure communication and deep insights into your applications out of the box.

Basic Configuration of Dapr

Configuring Dapr is a straightforward process. In self-hosted mode, you work with a configuration file, such as config.yaml. For Kubernetes, Dapr utilizes a Configuration resource that you apply to the cluster. You can then annotate your Kubernetes deployment pods to seamlessly integrate with Dapr, enabling features like mTLS and observability.

Key Steps for Configuration in Kubernetes

  1. Installing Dapr on the Kubernetes Cluster: First, you need to install the Dapr Runtime in your cluster. This can be done using the Dapr CLI with the command dapr init -k. This command installs Dapr as a set of deployments in your Kubernetes cluster.
  2. Creating the Configuration File: For Kubernetes, Dapr configuration is defined in a YAML file. This file specifies various parameters for Dapr’s runtime behavior, such as tracing, mTLS, and middleware configurations.
  3. Applying the Configuration to the Cluster: Once you have your configuration file, you need to apply it to your Kubernetes cluster. This is done using kubectl apply -f <configuration-file.yaml>. This step registers the configuration with Dapr’s control plane.
  4. Annotating Kubernetes Deployments: To enable Dapr for a Kubernetes deployment, you annotate the deployment’s YAML file. This annotation instructs Dapr to inject a sidecar container into your Kubernetes pods.

Example Configuration File (config.yaml)

Here’s an example of a basic Dapr configuration file for Kubernetes:

apiVersion: dapr.io/v1alpha1
kind: Configuration
metadata:
  name: dapr-config
  namespace: default
spec:
  tracing:
    samplingRate: "1"
    zipkin:
      endpointAddress: "http://zipkin.default.svc.cluster.local:9411/api/v2/spans"
  mtls:
    enabled: true
  accessControl:
    defaultAction: "allow"
    trustDomain: "public"
    policies:
      - appId: "example-app"
        defaultAction: "allow"
        trustDomain: "public"
        namespace: "default"
        operationPolicies:
          - operation: "invoke"
            httpVerb: ["POST", "GET"]
            action: "allow"

This configuration file sets up basic tracing with Zipkin, enables mTLS, and defines access control policies. You can customize it further based on your specific requirements and environment.

Real-World Use Case: Alibaba’s Adoption of Dapr

Alibaba, a giant in the e-commerce space, turned to Dapr to address its growing need for a multi-language, microservices-friendly environment. With a diverse technology stack and a rapid shift towards cloud-native technologies, Alibaba needed a solution that could support various languages and provide a lightweight approach for FaaS and serverless scenarios. Dapr’s sidecar architecture fit the bill perfectly, allowing Alibaba to build elastic, stateless, and stateful applications with ease.

Enhancing Your Kubernetes Experience with Dapr

Embarking on the journey of installing Dapr on Kubernetes offers more than just setting up a tool; it’s about enhancing your Kubernetes experience with the power of Dapr’s capabilities. To begin, the installation of the Dapr CLI is your first step. This CLI is not just a tool; it’s your companion in deploying and managing applications with Dapr sidecars, a crucial aspect for microservices architecture.

Detailed Steps for a Robust Installation

  1. Installing the Dapr CLI:
    • The Dapr CLI is available for various platforms and can be downloaded from the official Dapr release page.
    • Once downloaded, follow the specific installation instructions for your operating system.
  2. Initializing Dapr in Your Kubernetes Cluster:
    • With the CLI installed, run dapr init -k in your terminal. This command deploys the Dapr control plane to your Kubernetes cluster.
    • It sets up various components like the Dapr sidecar injector, Dapr operator, Sentry for mTLS, and more.
  3. Verifying the Installation:
    • Ensure that all the Dapr components are running correctly in your cluster by executing kubectl get pods -n dapr-system.
    • This command should list all the Dapr components, indicating their status.
  4. Exploring Dapr Dashboard:
    • For a more visual approach, you can deploy the Dapr dashboard in your cluster using dapr dashboard -k.
    • This dashboard provides a user-friendly interface to view and manage your Dapr components and services.

With Dapr installed in your Kubernetes environment, you unlock a suite of capabilities that streamline microservices development and management. Dapr’s sidecars abstract away the complexities of inter-service communication, state management, and event-driven architectures. This abstraction allows developers to focus on writing business logic rather than boilerplate code for service interaction.

Embracing the Future with Dapr in Kubernetes

Dapr is revolutionizing the landscape of microservices development and management on Kubernetes. Its language-agnostic nature, inherent resilience, and straightforward configuration process position Dapr as a vital asset in the cloud-native ecosystem. Dapr’s appeal extends across the spectrum, from experienced microservices architects to newcomers in the field. It provides a streamlined approach to managing the intricacies of distributed applications.

Adopting Dapr in Kubernetes environments is particularly advantageous in scenarios where you need to ensure interoperability across different languages and frameworks. Its sidecar architecture and the range of building blocks it offers (like state management, pub/sub messaging, and service invocation) simplify complex tasks. This makes it easier to focus on business logic rather than on the underlying infrastructure.

Moreover, Dapr’s commitment to open standards and community-driven development ensures that it stays relevant and evolves with the changing landscape of cloud-native technologies. This adaptability makes it a wise choice for organizations looking to future-proof their microservices architecture.

So, are you ready to embrace the simplicity that Dapr brings to the complex world of Kubernetes microservices? The future is here, and it’s powered by Dapr. With Dapr, you’re not just adopting a tool; you’re embracing a community and a paradigm shift in microservices architecture.