Static service account keys have an odd domestic quality to them. They begin life as a sensible convenience and, after a few months, end up tucked into variable groups, copied into wikis, or lurking in a repository with the innocent menace of a spare house key under a flowerpot. They work, certainly. So does leaving your front door on the latch. The problem is not whether it works. The problem is how long you can keep pretending it is a good idea.
This article shows how to let Azure DevOps authenticate to Google Cloud without creating or storing a long-lived service account key. Instead, Azure DevOps presents a short-lived OIDC token, Google Cloud checks that token against a workload identity provider, and the pipeline receives temporary Google credentials only for the duration of the job.
The result is cleaner, safer, and far less likely to produce the sort of sentence nobody enjoys reading in a postmortem, namely, “we found an old credential in a place that should not have contained a credential.”
Why this setup is worth the trouble
The old pattern is familiar. You create a Google Cloud service account, download a JSON key, store it somewhere “temporary”, and then spend the next year hoping nobody has copied it into four other places. Even if the key never leaks, it still becomes one more secret to rotate, one more thing to explain to auditors, and one more awkward dependency between your pipeline and a file that should not really exist.
Workload Identity Federation replaces that with short-lived trust. Azure DevOps proves who it is at runtime. Google Cloud verifies that proof. No static key is issued, no secret needs to be rotated, and there is much less housekeeping disguised as security.
Strictly speaking, you can grant permissions directly to the federated principal in Google Cloud. In this article, I am using service account impersonation instead. It is a little easier to reason about, it fits neatly with how many teams already model CI identities, and it behaves consistently across a wide range of Google Cloud services.
What is actually happening
Under the hood, the flow is less mystical than it first appears.
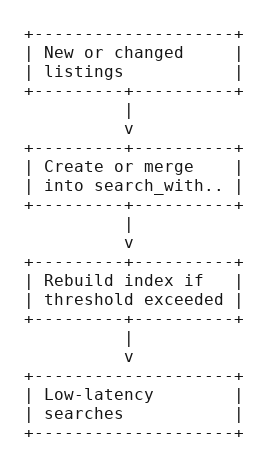
Azure DevOps has a service connection that can mint an OIDC ID token for the running pipeline. Google Cloud has a workload identity pool and an OIDC provider configured to trust tokens issued by that Azure DevOps organization. When the pipeline runs, it retrieves the token, writes a small credential configuration file, and uses that file to exchange the token for temporary Google credentials. Those credentials are then used to impersonate a Google Cloud service account with the exact roles needed for the job.
If you prefer a more ordinary analogy, think of it as a reception desk in an office building. Azure DevOps arrives with a temporary visitor badge. Google Cloud checks whether the badge was issued by a reception desk it trusts, whether it belongs to the expected visitor, and whether that visitor is allowed through the next door. If all of that checks out, access is granted for a while and then expires. Nobody hands over the master keys to the building.
Preparing Azure DevOps
The Azure DevOps side is simpler than it first looks, although the menus do their best to suggest otherwise.
Create an Azure Resource Manager service connection in your Azure DevOps project and use these settings:
- Identity type: App registration (automatic)
- Credential: Workload identity federation
- Scope level: Subscription
Yes, you still need to select a subscription even if your real destination is Google Cloud. It feels slightly like being asked for your train ticket while boarding a ferry, but that is the supported path.
Once the service connection is saved, note down two values from the Workload Identity federation details section:
- Issuer
- Subject identifier
The issuer identifies your Azure DevOps organization. The subject identifier identifies the service connection. In practice, the subject identifier follows this pattern:
sc://your-organization/your-project/your-service-connectionThat detail matters because Google Cloud will ultimately trust this specific identity, not merely “some pipeline from somewhere in the general direction of Azure.”
A practical naming note is worth making here. Choose a stable, descriptive service connection name early. Renaming things later is always possible in the same way as replacing the plumbing in a bathroom is possible. The word possible is doing quite a lot of work.
Teaching Google Cloud to trust Azure DevOps
Now we move to Google Cloud, where the important trick is to trust the right thing in the right way.
Create a dedicated workload identity pool and OIDC provider. You can do this from the console, but the CLI version is easier to keep, review, and repeat.
export IDENTITY_PROJECT_ID="acme-identity-hub"
export IDENTITY_PROJECT_NUMBER="998877665544"
export POOL_ID="ado-pool"
export PROVIDER_ID="ado-oidc"
export ISSUER_URI="https://vstoken.dev.azure.com/11111111-2222-3333-4444-555555555555"

# Enable the required APIs

gcloud services enable \
  iam.googleapis.com \
  cloudresourcemanager.googleapis.com \
  iamcredentials.googleapis.com \
  sts.googleapis.com \
  --project="$IDENTITY_PROJECT_ID"

# Create the workload identity pool

gcloud iam workload-identity-pools create "$POOL_ID" \
  --project="$IDENTITY_PROJECT_ID" \
  --location="global" \
  --display-name="Azure DevOps pool" \
  --description="Federation trust for Azure DevOps pipelines"

# Create the OIDC provider

gcloud iam workload-identity-pools providers create-oidc "$PROVIDER_ID" \
  --project="$IDENTITY_PROJECT_ID" \
  --location="global" \
  --workload-identity-pool="$POOL_ID" \
  --display-name="Azure DevOps provider" \
  --issuer-uri="$ISSUER_URI" \
  --allowed-audiences="api://AzureADTokenExchange" \
  --attribute-mapping="google.subject=assertion.sub.extract('/sc/{service_connection}')"
There are two details here that are easy to get wrong.
First, the allowed audience for the provider is “api://AzureADTokenExchange”. It is not a random per-connection UUID, and it is not the audience string that later appears inside the external account credential file used by the pipeline.
Second, the attribute mapping should not map “google.subject” to “assertion.aud”. For Azure DevOps, the supported workaround for the 127 byte subject limit is to extract the service connection portion from the “sub” claim:
google.subject=assertion.sub.extract('/sc/{service_connection}')This matters because the raw Azure DevOps subject can be too long for “google.subject”. Extracting the useful part solves the length issue neatly and still gives Google Cloud a stable subject to authorize.
You do not need an attribute condition for Azure DevOps. The issuer is already tenant-specific, which keeps this case pleasantly less dramatic than some other CI systems.
Creating the service account
Next, create the Google Cloud service account that your pipeline will impersonate.
The exact roles depend on what your pipeline needs to do. If the job only uploads artifacts to Cloud Storage, grant a storage role and stop there. If it deploys Cloud Run services, grant the Cloud Run roles it genuinely needs. This is one of those rare moments in cloud engineering where restraint is both morally admirable and operationally useful.
Here is a simple example:
export DEPLOY_PROJECT_ID="acme-observability-dev"
export SERVICE_ACCOUNT_NAME="ci-deployer"
export SERVICE_ACCOUNT_EMAIL="${SERVICE_ACCOUNT_NAME}@${DEPLOY_PROJECT_ID}.iam.gserviceaccount.com"
export FEDERATED_SUBJECT="your-organization/your-project/your-service-connection"

# Create the service account

gcloud iam service-accounts create "$SERVICE_ACCOUNT_NAME" \
  --project="$DEPLOY_PROJECT_ID" \
  --display-name="CI deployer for Azure DevOps"

# Grant only the roles your pipeline really needs

gcloud projects add-iam-policy-binding "$DEPLOY_PROJECT_ID" \
  --member="serviceAccount:${SERVICE_ACCOUNT_EMAIL}" \
  --role="roles/storage.objectAdmin"

# Allow the federated Azure DevOps identity to impersonate the service account

gcloud iam service-accounts add-iam-policy-binding "$SERVICE_ACCOUNT_EMAIL" \
  --project="$DEPLOY_PROJECT_ID" \
  --role="roles/iam.workloadIdentityUser" \
  --member="principal://iam.googleapis.com/projects/${IDENTITY_PROJECT_NUMBER}/locations/global/workloadIdentityPools/${POOL_ID}/subject/${FEDERATED_SUBJECT}"
The “FEDERATED_SUBJECT” value must match the subject produced by your attribute mapping. In plain English, that means the service connection identity that Google Cloud should trust. If the pool lives in one project and the service account lives in another, that is fine, but be careful to use the project number of the identity project in the principal URI.
Building the pipeline
Now for the part everyone actually came for.
The pipeline below uses the AzureCLI task to obtain the Azure DevOps OIDC token, stores it in a temporary file, writes an external account credential file for Google Cloud, signs in with “gcloud”, and then runs a test command.
trigger:
- main

pool:
  vmImage: 'ubuntu-latest'

variables:
  azureServiceConnection: 'gcp-federation-prod'
  gcpProjectId: 'acme-observability-dev'
  gcpProjectNumber: '998877665544'
  gcpPoolId: 'ado-pool'
  gcpProviderId: 'ado-oidc'
  gcpServiceAccount: 'ci-deployer@acme-observability-dev.iam.gserviceaccount.com'
  GOOGLE_APPLICATION_CREDENTIALS: '$(Pipeline.Workspace)/gcp-wif.json'

steps:
- checkout: self

- task: AzureCLI@2
  displayName: 'Authenticate to Google Cloud with workload identity federation'
  inputs:
    azureSubscription: '$(azureServiceConnection)'
    addSpnToEnvironment: true
    scriptType: 'bash'
    scriptLocation: 'inlineScript'
    inlineScript: |
      set -euo pipefail

      TOKEN_FILE="$(Pipeline.Workspace)/ado-token.jwt"
      printf '%s' "$idToken" > "$TOKEN_FILE"

      cat > "$GOOGLE_APPLICATION_CREDENTIALS" <<EOF
      {
        "type": "external_account",
        "audience": "//iam.googleapis.com/projects/$(gcpProjectNumber)/locations/global/workloadIdentityPools/$(gcpPoolId)/providers/$(gcpProviderId)",
        "subject_token_type": "urn:ietf:params:oauth:token-type:jwt",
        "token_url": "https://sts.googleapis.com/v1/token",
        "credential_source": {
          "file": "$TOKEN_FILE"
        },
        "service_account_impersonation_url": "https://iamcredentials.googleapis.com/v1/projects/-/serviceAccounts/$(gcpServiceAccount):generateAccessToken"
      }
      EOF

      gcloud auth login --cred-file="$GOOGLE_APPLICATION_CREDENTIALS" --quiet
      gcloud config set project "$(gcpProjectId)" --quiet

      echo "Authenticated as federated workload"
      gcloud storage buckets list --limit=5
A couple of details are doing more work here than they appear to be doing.
“addSpnToEnvironment: true” is essential. Without it, the task does not expose the “idToken” variable to your script. The pipeline then behaves like a very polite person who has shown up for an exam without bringing a pen.
The “audience” inside the generated JSON file is also important. This is the full resource name of the workload identity provider in Google Cloud. It is not the same thing as the allowed audience configured on the provider itself. The two values serve different purposes, which is perfectly reasonable once you know it and deeply annoying before you do.
An alternative credential file approach
If you prefer to generate the configuration file with “gcloud” rather than writing JSON inline, you can do that too:
gcloud iam workload-identity-pools create-cred-config \
  "projects/${gcpProjectNumber}/locations/global/workloadIdentityPools/${gcpPoolId}/providers/${gcpProviderId}" \
  --service-account="${gcpServiceAccount}" \
  --credential-source-file="$TOKEN_FILE" \
  --output-file="$GOOGLE_APPLICATION_CREDENTIALS"
That version is perfectly serviceable and often a little tidier if you dislike heredocs. I have shown the explicit JSON version in the main pipeline because it makes each moving part visible, which is useful while learning or troubleshooting.
Common pitfalls
There are a few places where people lose an afternoon.
The token exists, but the pipeline still fails
Make sure the AzureCLI task is using the correct service connection and that “addSpnToEnvironment” is enabled. If “$idToken” is empty, the problem is usually on the Azure DevOps side, not in Google Cloud.
The principal binding looks right, but impersonation is denied
Check the project number in the principal URI. It must be the project number that owns the workload identity pool, not necessarily the project where the service account lives.
Also, check the federated subject. Because of the attribute mapping, the subject is the extracted service connection path, not the raw OIDC subject, and not a made-up shorthand invented during a stressful coffee break.
The pipeline freezes on an authentication prompt
Use ‘–quiet’ with ‘gcloud auth login’ and similar commands. CI jobs are many things, but conversationalists they are not.
Hosted agents are not available
If your Azure DevOps organization has not yet been granted hosted parallelism, use a self-hosted agent temporarily. In that case, make sure the machine already has ‘az’ and ‘gcloud’ installed and available on the ‘PATH’.
A minimal self-hosted pool declaration looks like this:
pool:
  name: 'Default'
On Windows, remember to switch the script type to PowerShell or PowerShell Core and adjust the environment variable syntax accordingly.
Leaving the keys behind
This setup removes one of the more tiresome habits of cross-cloud automation, namely, manufacturing a secret only to spend the rest of its natural life protecting it from yourself. Azure DevOps can obtain a short-lived token, Google Cloud can verify it, and your pipeline can impersonate a tightly scoped service account without anybody downloading a JSON key and promising to delete it later.
That is the technical benefit. The practical benefit is even nicer. Once this is in place, your pipeline starts to feel less like a cupboard full of labelled jars, some of which may or may not contain explosives, and more like a system that knows who it is, proves it when asked, and then gets on with the job.
Which, in cloud engineering, is about as close as one gets to elegance.