Let’s be honest. For the better part of a decade, the public cloud has been the charismatic, free-spending friend who gets you out of any jam. Need to throw a last-minute party for a million users? They’ve got the hardware. Need to scale an app overnight? They’re already warming up the car. It was fast, it was elastic, and it saved you from the tedious, greasy work of racking your own servers. The only price was a casual, “You can pay me back later.”
Well, it’s later. The bill has arrived, and it has more cryptic line items than a forgotten ancient language. The finance department is calling, and they don’t sound happy.
This isn’t an angry stampede for the exits. Nobody is burning their AWS credits in protest. It’s more of a pragmatic reshuffle, a collective moment of clarity. Teams are looking at their sprawling digital estates and asking a simple question: Does everything really need to live in this expensive, all-inclusive resort? The result is a new normal where the cloud is still essential, just not universal.
The financial hangover
The cloud is wonderfully elastic. Elastic things, by their nature, bounce. So do monthly statements. Teams that scaled at lightning speed are now waking up to a familiar financial hangover with four distinct symptoms. First, there’s the billing complexity. Your monthly invoice isn’t a bill; it’s a mystery novel written by a sadist. Thousands of line items, tiered pricing, and egress charges transform the simple act of “moving data” into a budget-devouring monster.
-- A query that looks innocent but costs a fortune in data egress
SELECT
    event_id,
    user_id,
    payload
FROM
    user_events_production.events_archive
WHERE
    event_date BETWEEN '2025-07-01' AND '2025-07-31'
    AND region != 'eu-central-1'; -- Oh, you wanted to move 5TB across continents? That'll be extra.
Second is the unpredictable demand. A few busy weeks, a successful marketing campaign, or a minor viral event can undo months of careful savings plans. You budget for a quiet month, and suddenly you’re hosting the Super Bowl.
Then come the hidden multipliers. These are the gremlins of your infrastructure. Tiny, seemingly insignificant charges for cross-AZ traffic, managed service premiums, and per-request pricing that quietly multiply in the dark, feasting on your budget.
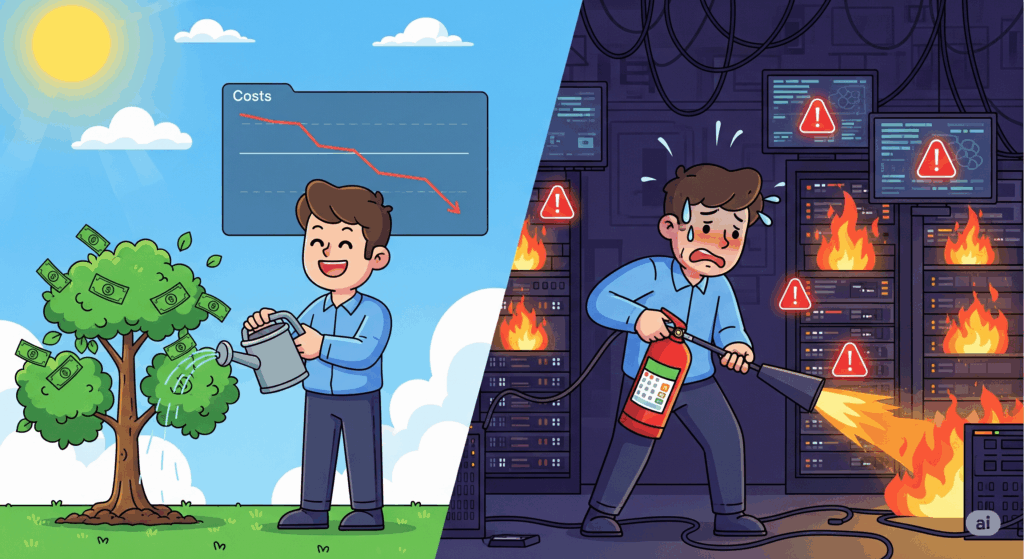
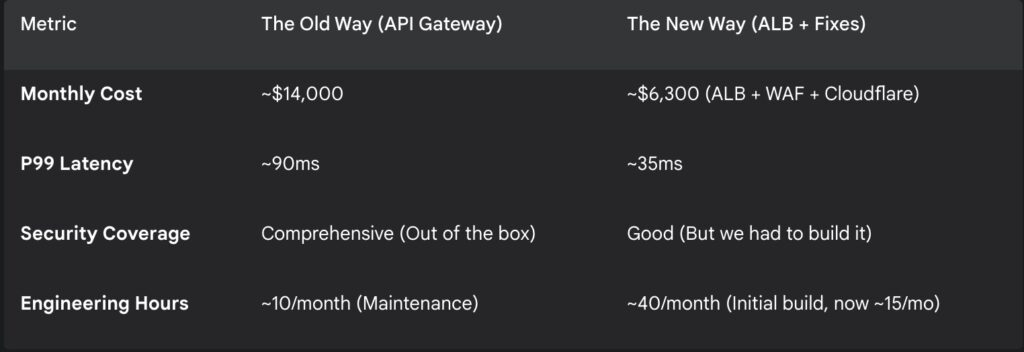
Finally, there’s the convenience tax. You paid a premium to turn the pain of operations into someone else’s problem. But for workloads that are steady, predictable, and bandwidth-heavy, that convenience starts to look suspiciously like setting money on fire. Those workloads are starting to look much cheaper on hardware you own or lease, where capital expenditure and depreciation replace the tyranny of per-hour-everything.
The gilded cage of convenience
Cloud providers don’t lock you in with malice. They seduce you with helpfulness. They offer a proprietary database so powerful, an event bus so seamless, an identity layer so integrated that before you know it, your application is woven into the very fabric of their ecosystem.
Leaving isn’t a migration; it’s a full-scale renovation project. It’s like living in a luxury hotel. They don’t forbid you from leaving, but once you’re used to the 24/7 room service, are you really going to go back to cooking for yourself?
Faced with this gilded cage, smart teams are now insisting on a kind of technological prenuptial agreement. It’s not about a lack of trust; it’s about preserving future freedom. Where practical, they prefer:
- Open databases or engines with compatible wire protocols.
- Kubernetes with portable controllers over platform-specific orchestration.
- OpenTelemetry for metrics and traces that can travel.
- Terraform or Crossplane to describe infrastructure in a way that isn’t tied to one vendor.
This isn’t purity theater. It simply reduces the penalty for changing your mind later.
# A portable infrastructure module
# It can be pointed at AWS, GCP, or even an on-prem vSphere cluster
# with the right provider.

resource "kubernetes_namespace" "app_namespace" {
  metadata {
    name = "my-awesome-app"
  }
}

resource "helm_release" "app_database" {
  name       = "app-postgres"
  repository = "https://charts.bitnami.com/bitnami"
  chart      = "postgresql"
  namespace  = kubernetes_namespace.app_namespace.metadata[0].name

  values = [
    "${file("values/postgres-prod.yaml")}"
  ]
}
A new menu of choices
The choice is no longer just between a hyperscaler and a dusty server cupboard under the stairs. The menu has expanded:
- Private cloud: Using platforms like OpenStack or Kubernetes on bare metal in a modern colocation facility.
- Alternative clouds: A growing number of providers are offering simpler pricing and less lock-in.
- Hybrid models: Keeping sensitive data close to home while bursting to public regions for peak demand.
- Edge locations: For workloads that need to be physically close to users and hate round-trip latency.
The point isn’t to flee the public cloud. The point is workload fitness. You wouldn’t wear hiking boots to a wedding, so why run a predictable, data-heavy analytics pipeline on a platform optimized for spiky, uncertain web traffic?
A personality test for your workload
So, how do you decide what stays and what goes? You don’t need a crystal ball. You just need to give each workload a quick personality test. Ask these six questions:
- Is its demand mostly steady or mostly spiky? Is it a predictable workhorse or a temperamental rock star?
- Is its data large and chatty or small and quiet?
- Is latency critical? Does it need instant responses or is a few dozen milliseconds acceptable?
- Are there strict data residency or compliance rules?
- Does it rely on a proprietary managed service that would be a nightmare to replace?
- Can we measure its unit economics? Do we know the cost per request, per user, or per gigabyte processed?
Steady and heavy often wins on owned or leased hardware. Spiky and uncertain still loves the elasticity of the hyperscalers. Regulated and locality-bound prefer the control of a private or hybrid setup. And if a workload gets its superpowers from a proprietary managed service, you either keep it where its powers live or make peace with a less super version of your app.
What does this mean for you, Architect
If you’re a DevOps engineer or a Cloud Architect, congratulations. Your job description just grew a new wing. You are no longer just a builder of digital infrastructure; you are now part financial planner, part supply chain expert, and part treaty negotiator.
Your playbook now includes:
- FinOps literacy: The ability to connect design choices to money in a way the business understands and trusts.
- Portability patterns: Designing services that can move without a complete rewrite.
- Hybrid networking: Weaving together different environments without creating a haunted house of routing tables and DNS entries.
- Observability without borders: Using vendor-neutral signals to see what’s happening from end to end.
- Procurement fluency: The skill to make apples-to-apples comparisons between amortized hardware, managed services, and colocation contracts.
Yes, it’s time to carry a pocket calculator again, at least metaphorically.
The unsexy path to freedom
The journey back from the cloud is paved with unglamorous but essential work. It’s not a heroic epic; it’s a series of small, carefully planned steps. The risks are real. You have to account for the people cost of patching and maintaining private platforms, the lead times for hardware, and the shadow dependencies on convenient features you forgot you were using.
The antidote is small steps, honest metrics, and boringly detailed runbooks. Start with a proof-of-concept, create a migration plan that moves slices, not the whole cake, and have rollback criteria that a non-engineer can understand.
This is just a course correction
The Great Cloud Exit is less a rebellion and more a rationalization. Think of it as finally cleaning out your closet after a decade-long shopping spree. The public cloud gave us a phenomenal decade of speed, and we bought one of everything. Now, we’re sorting through the pile. That spiky, unpredictable web service? It still looks great in the elastic fabric of a hyperscaler. That massive, steady-state analytics database? It’s like a heavy wool coat that was never meant for the tropics; it’s time to move it to a more suitable climate, like your own data center. And that experimental service you spun up in 2019 and forgot about? That’s the impulse buy sequin jacket you’re never going to wear. Time to donate it.
Treating workload placement as a design problem instead of a loyalty test is liberating. It’s admitting you don’t need a Swiss Army knife when all you have to do is turn a single screw. Choosing the right environment for the job results in a system that costs less and complains less. It performs better because it’s not being forced to do something it was never designed for.
This leads to the most important outcome: options. In a landscape that changes faster than we can update our résumés, flexibility is the only superpower that truly matters. The ability to move, to adapt, and to choose without facing a punishing exit fee or a six-month rewrite, that’s the real prize. The cloud isn’t the destination anymore; it’s just one very useful stop on the map.