I once bought a five-minute rice cooker that spent four of those minutes warming up with a pathetic hum. It delivered the goods, eventually, but the promise felt… deceptive. For years, AWS Lambda felt like that gadget. It was the perfect kitchen tool for the odd jobs: a bit of glue code here, a light API there. It was the brilliant, quick-fire microwave of our architecture.
Then our little kitchen grew into a full-blown restaurant. Our “hot path”, the user checkout process, became the star dish on our menu. And our diners, quite rightly, expected it to be served hot and fast every time, not after a polite pause while the oven preheated. That polite pause was our cold start, and it was starting to leave a bad taste.
This isn’t a story about how we fell out of love with Lambda. We still adore it. This is the story of how we moved our main course to an industrial-grade, always-on stove. It’s about what we learned by obsessively timing every step of the process and why we still keep that trusty microwave around for the side dishes it cooks so perfectly. Because when your p95 latency needs to be boringly predictable, keeping the kitchen warm isn’t a preference; it’s a law of physics.
What forced us to remodel the kitchen
No single event pushed us over the edge. It was more of a slow-boiling frog situation, a gradual realization that our ambitions were outgrowing our tools. Three culprits conspired against our sub-300ms dream.
First, our traffic got moody. What used to be a predictable tide of requests evolved into sudden, sharp tsunamis during business hours. We needed a sea wall, not a bucket.
Second, our user expectations tightened. We set a rather tyrannical goal of a sub-300ms p95 for our checkout and search paths. Suddenly, the hundreds of milliseconds Lambda spent stretching and yawning before its first cup of coffee became a debt we couldn’t afford.
Finally, our engineers were getting tired. We found ourselves spending more time performing sacred rituals to appease the cold start gods, fiddling with layers, juggling provisioned concurrency, than we did shipping features our users actually cared about. When your mechanics spend more time warming up the engine than driving the car, you know something’s wrong.
The punchline isn’t that Lambda is “bad.” It’s that our requirements changed. When your performance target drops below the cost of a cold start plus dependency initialization, physics sends you a sternly worded letter.
Numbers don’t lie, but anecdotes do
We don’t ask you to trust our feelings. We ask you to trust the stopwatch. Replicate this experiment, adjust it for your own tech stack, and let the data do the talking. The setup below is what we used to get our own facts straight. All results are our measurements as of September 2025.
The test shape
- Endpoint: Returns a simple 1 KB JSON payload.
- Comparable Compute: Lambda set to 512 MB vs. an ECS Fargate container task with 0.5 vCPU and 1 GB of memory.
- Load Profile: A steady, closed-loop 100 requests per second (RPS) for 10 minutes.
- Metrics Reported: p50, p90, p95, p99 latency, and the dreaded error rate.
Our trusty tools
- Load Generator: The ever-reliable k6.
- Metrics: A cocktail of CloudWatch and Prometheus.
- Dashboards: Grafana, to make the pretty charts that managers love.
Your numbers will be different. That’s the entire point. Run the tests, get your own data, and then make a decision based on evidence, not a blog post (not even this one).
Where our favorite gadget struggled
Under the harsh lights of our benchmark, Lambda’s quirks on our hot path became impossible to ignore.
- Cold start spikes: Provisioned Concurrency can tame these, but it’s like hiring a full-time chauffeur to avoid a random 10-minute wait for a taxi. It costs you a constant fee, and during a real rush hour, you might still get stuck in traffic.
- The startup toll: Initializing SDKs and warming up connections added tens to hundreds of milliseconds. This “entry fee” was simply too high to hide under our 300ms p95 goal.
- The debugging labyrinth: Iterating was slow. Local emulators helped, but parity was a myth that occasionally bit us. Debugging felt like detective work with half the clues missing.
Lambda continues to be a genius for event glue, sporadic jobs, and edge logic. It just stopped being the right tool to serve our restaurant’s most popular dish at rush hour.
Calling in the heavy artillery
We moved our high-traffic endpoints to container-native services. For us, that meant ECS on Fargate fronted by an Application Load Balancer (ALB). The core idea is simple: keep a few processes warm and ready at all times.
Here’s why it immediately helped:
- Warm processes: No more cold start roulette. Our application was always awake, connection pools were alive, and everything was ready to go instantly.
- Standardized packaging: We traded ZIP files for standard Docker images. What we built and tested on our laptops was, byte for byte, what we shipped to production.
- Civilized debugging: We could run the exact same image locally and attach a real debugger. It was like going from candlelight to a floodlight.
- Smarter scaling: We could maintain a small cadre of warm tasks as a baseline and then scale out aggressively during peaks.
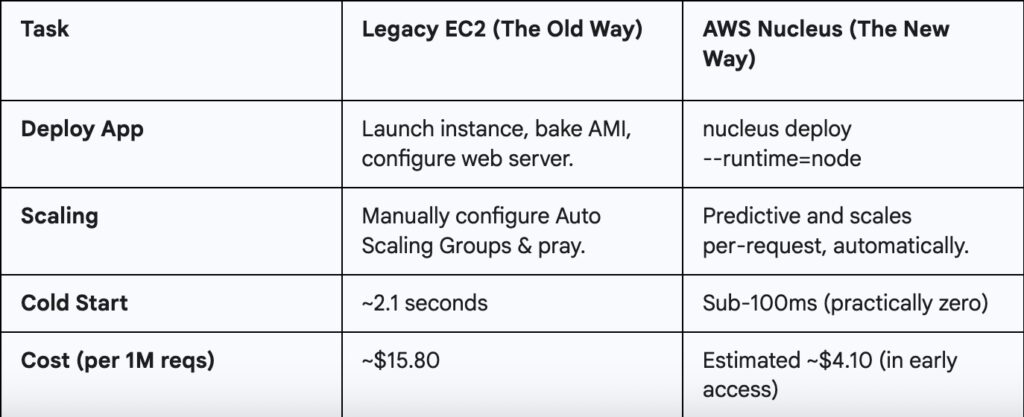
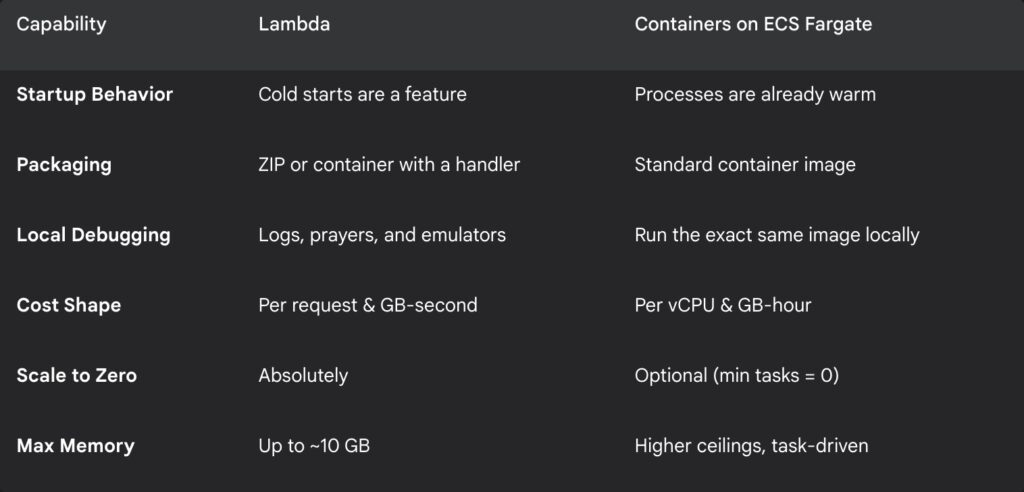
A quick tale of the tape
Here’s a simplified look at how the two approaches stacked up for our specific needs.
Our surprisingly fast migration plan
We did this in days, not weeks. The key was to be pragmatic, not perfect.
1. Pick your battles: We chose our top three most impactful endpoints with the worst p95 latency.
2. Put it in a box: We converted the function handler into a tiny web service. It’s less dramatic than it sounds.
# Dockerfile (Node.js example)
FROM node:22-slim
WORKDIR /usr/src/app

COPY package*.json ./
RUN npm ci --only=production

COPY . .

ENV NODE_ENV=production PORT=3000
EXPOSE 3000
CMD [ "node", "server.js" ]
// server.js
const http = require('http');
const port = process.env.PORT || 3000;
const server = http.createServer((req, res) => {
if (req.url === '/health') {
res.writeHead(200, { 'Content-Type': 'text/plain' });
return res.end('ok');
}
// Your actual business logic would live here
const body = JSON.stringify({ success: true, timestamp: Date.now() });
res.writeHead(200, { 'Content-Type': 'application/json' });
res.end(body);
});
server.listen(port, () => {
console.log(`Server listening on port ${port}`);
});3. Set up the traffic cop: We created a new target group for our service and pointed a rule on our Application Load Balancer to it.
{
  "family": "payment-api",
  "networkMode": "awsvpc",
  "cpu": "512",
  "memory": "1024",
  "requiresCompatibilities": ["FARGATE"],
  "executionRoleArn": "arn:aws:iam::987654321098:role/ecsTaskExecutionRole",
  "taskRoleArn": "arn:aws:iam::987654321098:role/paymentTaskRole",
  "containerDefinitions": [
    {
      "name": "app-container",
      "image": "[987654321098.dkr.ecr.us-east-1.amazonaws.com/payment-api:2.1.0](https://987654321098.dkr.ecr.us-east-1.amazonaws.com/payment-api:2.1.0)",
      "portMappings": [{ "containerPort": 3000, "protocol": "tcp" }],
      "environment": [{ "name": "NODE_ENV", "value": "production" }]
    }
  ]
}
4. The canary in the coal mine: We used weighted routing to dip our toes in the water. We started by sending just 5% of traffic to the new container service.
# Terraform Route 53 weighted canary
resource "aws_route53_record" "api_primary_lambda" {
  zone_id = var.zone_id
  name    = "api.yourapp.com"
  type    = "A"

  alias {
    name                   = aws_api_gateway_domain_name.main.cloudfront_domain_name
    zone_id                = aws_api_gateway_domain_name.main.cloudfront_zone_id
    evaluate_target_health = true
  }

  set_identifier = "primary-lambda-path"
  weight         = 95
}

resource "aws_route53_record" "api_canary_container" {
  zone_id = var.zone_id
  name    = "api.yourapp.com"
  type    = "A"

  alias {
    name                   = aws_lb.main_alb.dns_name
    zone_id                = aws_lb.main_alb.zone_id
    evaluate_target_health = true
  }

  set_identifier = "canary-container-path"
  weight         = 5
}
5. Stare at the graphs: For one hour, we watched four numbers like hawks: p95 latency, error rates, CPU/memory headroom on the new service, and our estimated cost per million requests.
6. Go all in (or run away): The graphs stayed beautifully, boringly flat. So we shifted to 50%, then 100%. The whole affair was done in an afternoon.
The benchmark kit you can steal
Don’t just read about it. Run a quick test yourself.
// k6 script (save as test.js)
import http from 'k6/http';
import { check, sleep } from 'k6';

export const options = {
  vus: 100,
  duration: '5m',
  thresholds: {
    'http_req_duration': ['p(95)<250'], // Aim for a 250ms p95
    'checks': ['rate>0.999'],
  },
};

export default function () {
  const url = __ENV.TARGET_URL || '[https://api.yourapp.com/checkout/v2/quote](https://api.yourapp.com/checkout/v2/quote)';
  const res = http.get(url);
  check(res, { 'status is 200': r => r.status === 200 });
  sleep(0.2); // Small pause between requests
}
Run it from your terminal like this:
k6 run -e TARGET_URL=https://your-canary-endpoint.com test.jsOur results for context
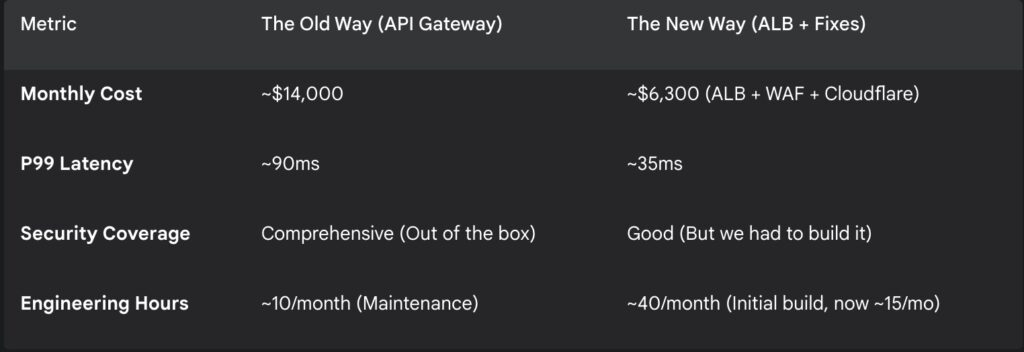
These aren’t universal truths; they are snapshots of our world. Your mileage will vary.
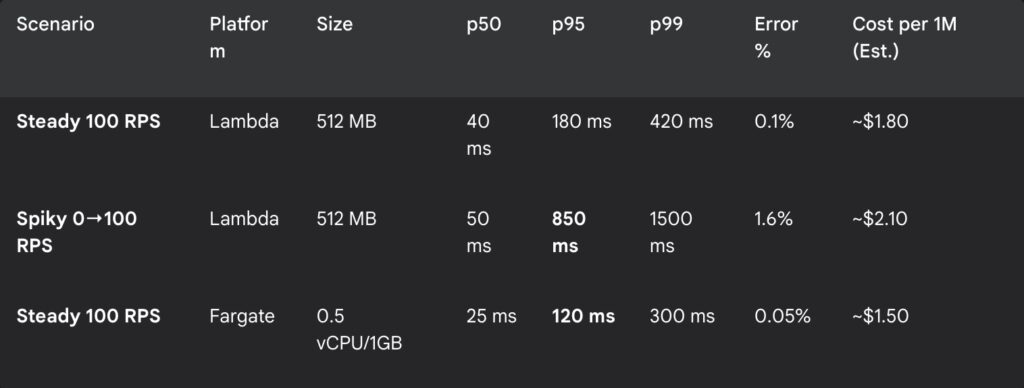
The numbers in bold are what kept us up at night and what finally let us sleep. For our steady traffic, the always-on container was not only faster and more reliable, but it was also shaping up to be cheaper.
Lambda is still in our toolbox
We didn’t throw the microwave out. We just stopped using it to cook the Thanksgiving turkey. Here’s where we still reach for Lambda without a second thought:
- Sporadic or bursty workloads: Those once-a-day reports or rare event handlers are perfect for scale-to-zero.
- Event glue: It’s the undisputed champion of transforming S3 puts, reacting to DynamoDB streams, and wiring up EventBridge.
- Edge logic: For tiny header manipulations or rewrites, Lambda@Edge and CloudFront Functions are magnificent.
Lambda didn’t fail us. We outgrew its default behavior for a very specific, high-stakes workload. We cheated physics by keeping our processes warm, and in return, our p95 stopped stretching like hot taffy.
If your latency targets and traffic shape look anything like ours, please steal our tiny benchmark kit. Run a one-day canary. See what the numbers tell you. The goal isn’t to declare one tool a winner, but to spend less time arguing with physics and more time building things that people love.