You press a finger against the greasy glass of your smartphone. You are in a café in Melbourne, the coffee is lukewarm, and you have made the executive decision to watch a video of a cat falling off a Roomba. It feels like a trivial action.
But for the data packet birthed by that tap, this is D-Day.
It is a tiny, nervous backpacker being kicked out into the digital wilderness with nothing but a destination address and a crippling fear of latency. Its journey through Amazon’s cloud infrastructure is not the clean, sterile diagram your systems architect drew on a whiteboard. It is a micro drama of hope, bureaucratic routing, and existential dread that plays out in roughly 200 milliseconds.
We tend to think of the internet as a series of tubes, but it is more accurate to think of it as a series of highly opinionated bouncers and overworked bureaucrats. To understand how your cat video loads, we have to follow this anxious packet through the gauntlet of Amazon Web Services (AWS).
The initial panic and the mapmaker with a god complex
Our packet leaves your phone and hits the cellular network. It is screaming for directions. It needs to find the server hosting the video, but it only has a name (e.g., cats.example.com). Computers do not speak English; they speak IP addresses.
Enter Route 53.
Amazon calls Route 53 a Domain Name System (DNS) service. In practice, it acts like a travel agent with a philosophy degree and multiple personality disorder. It does not just look up addresses; it judges you based on where you are standing and how healthy the destination looks.
If Route 53 is configured with Geolocation Routing, it acts like a local snob. It looks at our packet’s passport, sees “Melbourne,” and sneers. “You are not going to the Oregon server. The Americans are asleep, and the latency would be dreadful. You are going to Sydney.”
However, Route 53 is also a hypochondriac. Through Health Checks, it constantly pokes the servers to see if they are alive. It is the digital equivalent of texting a friend, “Are you awake?” every ten seconds. If the Sydney server fails to respond three times in a row, Route 53 assumes the worst, death, fire, or a kernel panic, and instantly reroutes our packet to Singapore. This is Failover Routing, the prepared pessimist of the group.
The packet doesn’t care about the logic. It just wants an address so it can stop hyperventilating in the void.
CloudFront is the desperate golden retriever of the internet
Armed with an IP address, our packet rushes toward the destination. But hopefully, it never actually reaches the main server. That would be inefficient. Instead, it runs into CloudFront.
CloudFront is a Content Delivery Network (CDN). Think of it as a network of convenience stores scattered all over the globe, so you don’t have to drive to the factory to buy milk. Or, more accurately, think of CloudFront as a Golden Retriever that wants to please you so badly it is vibrating.
Its job is caching. It memorizes content. When our packet arrives at the CloudFront “Edge Location” in Melbourne, the service frantically checks its pockets. “Do I have the cat video? I think I have the cat video. I fetched it for that guy in the corner five minutes ago!”
If it has the video (a Cache Hit), it hands it over immediately. The packet is relieved. The journey is over. Everyone goes home happy.
But if CloudFront cannot find the video (a Cache Miss), the mood turns sour. The Golden Retriever looks guilty. It now has to turn around and run all the way to the origin server to fetch the data fresh. This is the “Edge” of the network, a place that sounds like a U2 guitarist but is actually just a rack of humming metal in a secure facility near the airport.
The tragedy of CloudFront is the Time To Live (TTL). This is the expiration date on the data. If the TTL is set to 24 hours, CloudFront will proudly hand you a version of the website from yesterday, oblivious to the fact that you updated the spelling errors this morning. It is like a dog bringing you a dead bird it found last week, convinced it is still a great gift.
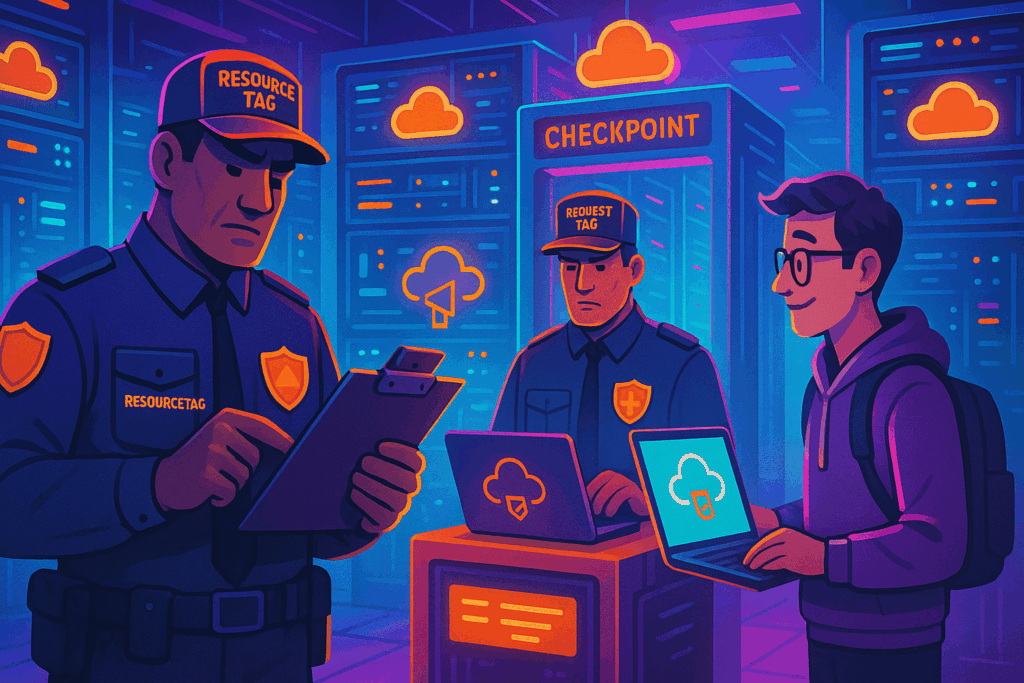
The security guard who judges your shoes
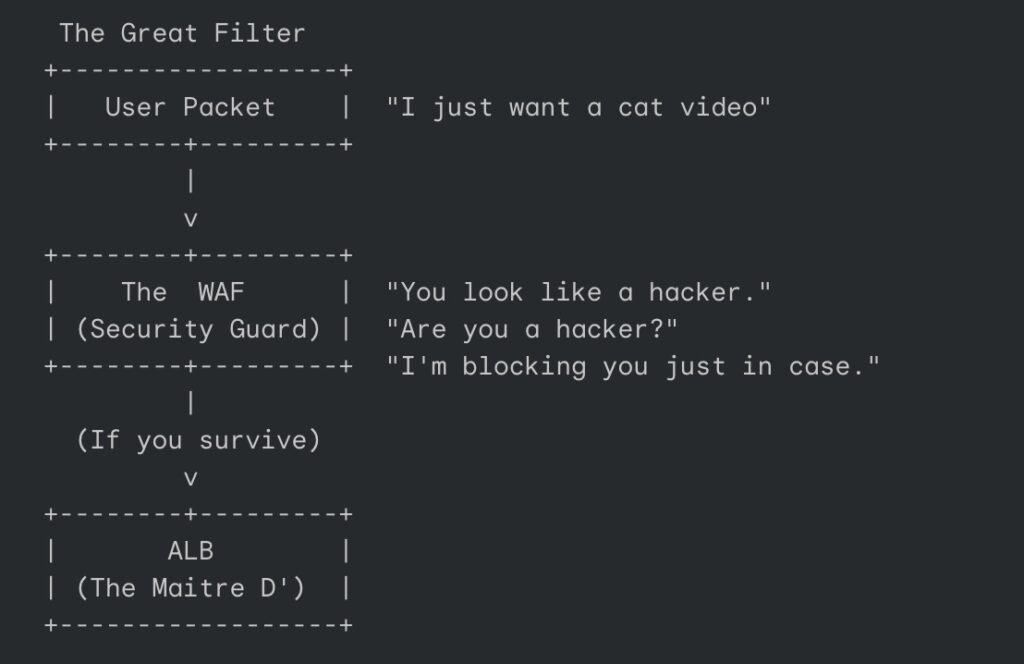
If our packet suffers a Cache Miss, it must travel deeper into the data center. But first, it has to get past the Web Application Firewall (WAF).
The WAF is not a firewall in the traditional sense; it is a nightclub bouncer who has had a very long shift and hates everyone. It stands at the velvet rope, scrutinizing every packet for signs of “malicious intent.”
It checks for SQL injection, which is the digital equivalent of trying to sneak a knife into the club tape-draped to your ankle. It checks for Cross-Site Scripting (XSS), which is essentially trying to trick the club into changing its name to “Free Drinks for Everyone.”
The WAF operates on a set of rules that range from reasonable to paranoid. Sometimes, it blocks a legitimate packet just because it looks suspicious, perhaps the packet is too large, or it came from a country the WAF has decided to distrust today. The packet pleads its innocence, but the WAF is a piece of software code; it does not negotiate. It simply returns a 403 Forbidden error, which translates roughly to: “Your shoes are ugly. Get out.”
The Application Load Balancer manages the VIP list
Having survived the bouncer, our weary packet arrives at the Application Load Balancer (ALB). If the WAF is the bouncer, the ALB is the Maitre D’ holding the clipboard.
The ALB is obsessed with fairness and health. It stands in front of a pool of identical servers (the Target Group) and decides who has to do the work. It is trying to prevent any single server from having a nervous breakdown due to overcrowding.
“Server A is busy processing a login request,” the ALB mutters. “Server B is currently restarting because it had a panic attack. You,” it points to our packet, “you go to Server C. It looks bored.”
The ALB’s relationship with the servers is codependent and toxic. It performs health checks on them relentlessly. It demands a 200 OK status code every thirty seconds. If a server takes too long to reply or replies with an error, the ALB declares it “Unhealthy” and stops sending it friends. It effectively ghosts the server until it gets its act together.
The Origin, where the magic (and heat) happens
Finally, the packet reaches the destination. The Origin.
We like to imagine the cloud as an ethereal, fluffy place. In reality, the Origin is likely an EC2 instance, a virtual slice of a computer sitting in a windowless room in Northern Virginia or Dublin. The room is deafeningly loud with the sound of cooling fans and smells of ozone and hot plastic.
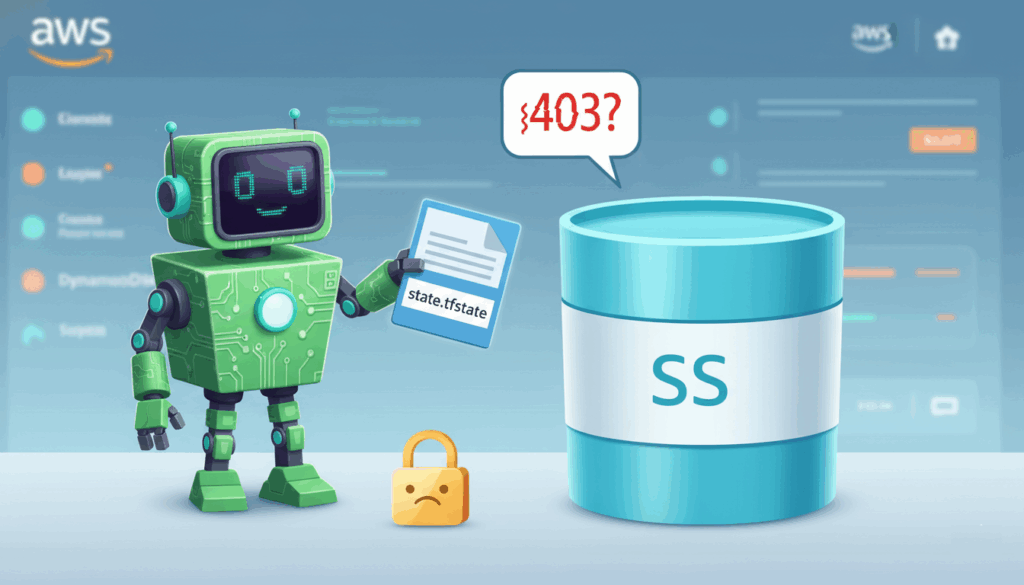
Here, the application code actually runs. The request is processed, and the server realizes it needs the actual video file. It reaches out to Amazon S3 (Simple Storage Service), which is essentially a bottomless digital bucket where the internet hoards its data.
The EC2 instance grabs the video from the bucket, processes it, and prepares to send it back.
This is the most fragile part of the journey. If the code has a bug, the server might vomit a 500 Internal Server Error. This is the server saying, “I tried, but I broke something inside myself.” If the database is overwhelmed, the request might time out.
When this happens, the failure cascades back up the chain. The ALB shrugs and tells the user “502 Bad Gateway” (translation: ” The guy in the back room isn’t talking to me”). The WAF doesn’t care. CloudFront caches the error page, so now everyone sees the error for the next hour.
And somewhere, a DevOps engineer’s phone starts buzzing at 3:00 AM.
The return trip
But today, the system works. The Origin retrieves the video bytes. It hands them to the ALB, which passes them to the WAF (who checks them one last time for contraband), which hands them to CloudFront, which hands them to the cellular network.
The packet returns to your phone. The screen flickers. The cat falls off the Roomba. You chuckle, swipe up, and request the next video.
You have no idea that you just forced a tiny, digital backpacker to navigate a global bureaucracy, evade a paranoid security guard, and wake up a server in a different hemisphere, all in less time than it takes you to blink. It is a modern marvel held together by fiber optics and anxiety.
So spare a thought for the data. It has seen things you wouldn’t believe.